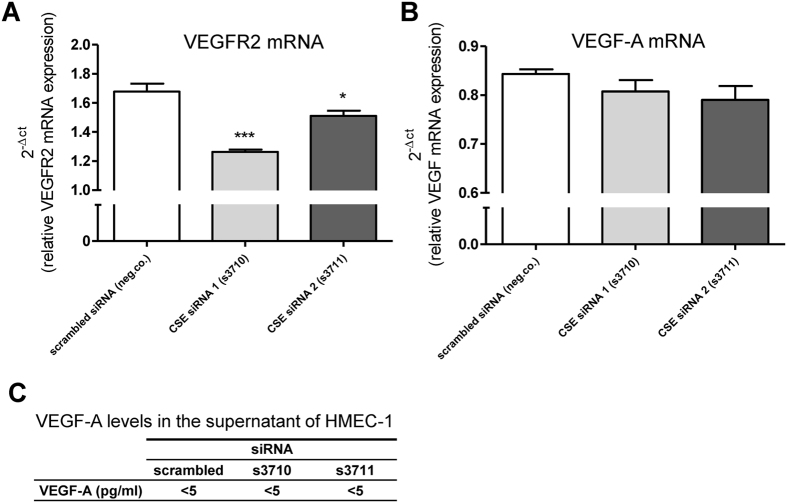
Figure 7. VEGFR2 and VEGF-A expression during CSE knockdown.
qRT-PCR analysis for VEGFR2 in cultured HMEC-1 cells, showing 25% (CSE siRNA 1) and 10% (CSE siRNA 2) decreased VEGFR2 mRNA expression (A) n = 3, in which each replicate was performed in triplicate. qRT-PCR analysis revealed no differences in VEGF-A mRNA expression levels in HMEC-1 cells after transfection with different siRNAs (B) n = 3, in which each replicate was performed in triplicate. ELISA revealed undetectable low VEGF-A concentrations in supernatant of transfected cells, and showed no differences in VEGF-A concentration in HMEC-1 cells after transfection with different siRNAs (C), n = 3, in which each replicate was performed in duplicate. Data were analyzed using Kruskal Wallis test. Normality was tested using the Kolmogorov–Smirnov test. Dunns post-hoc analysis was applied to correct for multiple comparisons.

