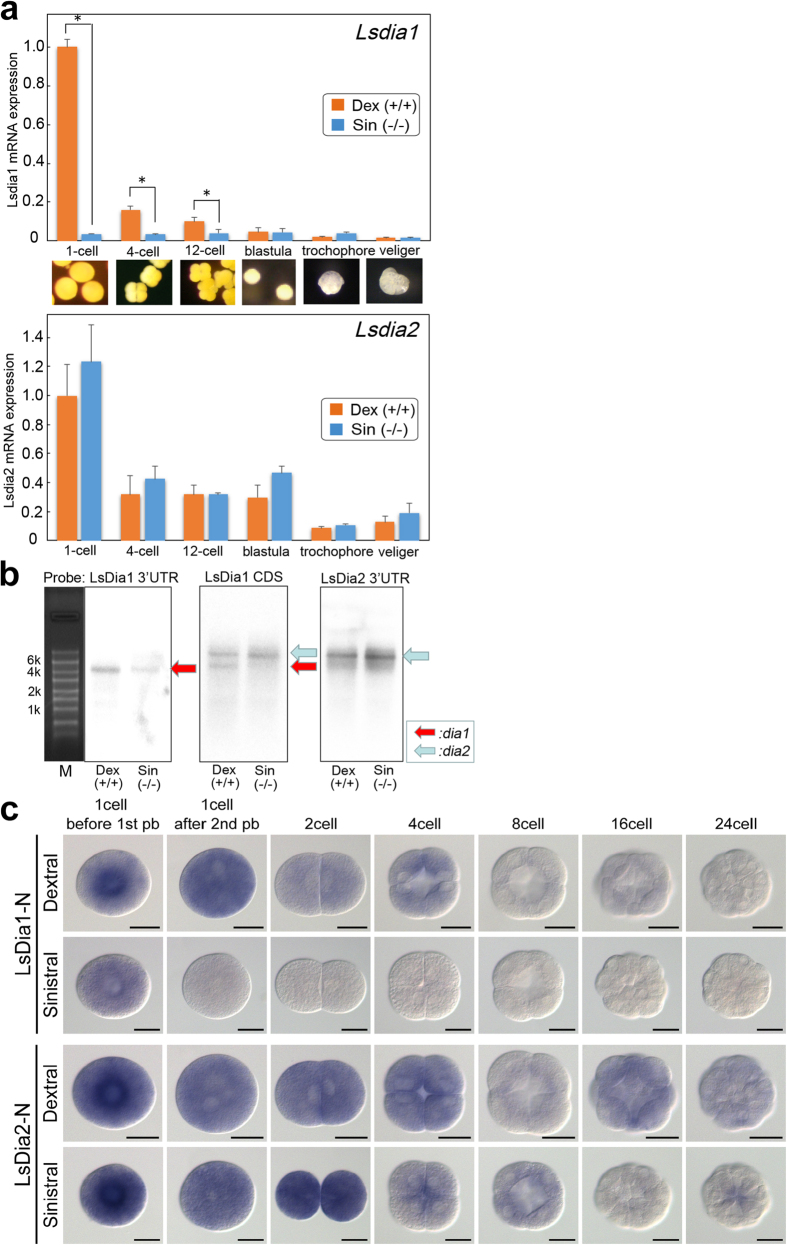
Figure 2. Comparison of Lsdia mRNA levels between dextral and sinistral snails during early development.
(a) Quantitative real time-PCR analysis showing the expression levels of Lsdia1 and Lsdia2 mRNA between dextral and sinistral strains. Gene expressions were assessed at six different developmental stages; 1-cell, 4-cell, 12-cell, blastula, trochophore, and veliger with two probes (Lsdia1-5′UTR and Lsdia2-3′UTR). Lstubb1 was used as a control. Data are shown as mean ± SD, calculated from four independent experiments. *P < 0.01. (b) Northern blot analysis showing the transcript size of Lsdia1 and Lsdia2 genes from dextral and sinistral strains. Gene expressions were assessed using 1-cell stage embryos. Three radioactive probes (Lsdia1-3′UTR, Lsdia1-CDS and Lsdia2-3′UTR) were analyzed. Lsactb mRNA bands served as a control for monitoring RNA loading. (c) Whole mount in situ hybridization showing the spatial and temporal expression patterns of Lsdia1 and Lsdia2 at seven different embryonic stages; 1-cell before 1st pb extrusion, 1-cell after the 2nd pb extrusion, 2-cell, 4-cell, 8-cell, 16-cell, and 24-cell stages. Gene expressions were assessed with a probe made for the CDS N-terminus region of Lsdia1 which overlaps the probe region for the northern blotting, and the CDS N-terminus region of Lsdia2. All images are animal pole views. Scale bar indicates 50 μm.

