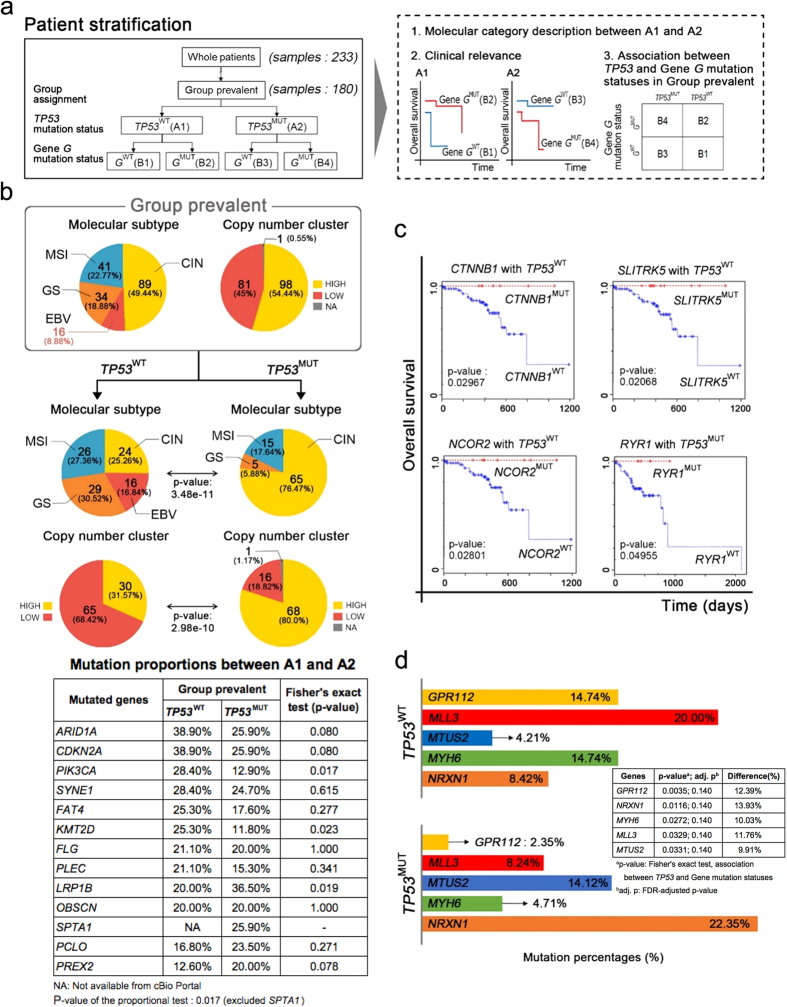
Figure 2. Molecular Phenotypes and Clinical Relevance of Group Prevalent in Association with TP53 mutation.
(a) In Group prevalent, we checked TP53 mutation status and assigned “A1” for TP53WT, and “A2” for TP53MUT (in the left rectangle). Then, we performed the three analyses (in the right dash rectangle). First, we analyzed the differences of molecular phenotypes between A1 and A2 (depicted in (b)). We analyzed survival (clinical relevance) with every gene’s mutation status, for each A1 and A2 (depicted in (c)). Finally, we performed Fisher’s exact test for each genes’ mutational status to confirm its statistical association with TP53 mutation status (depicted in (d)). (b) Subdivision of molecular subtype and copy number clusters show a different ratio between TP53WT and TP53MUT groups, within the entire population of Group prevalent. Also, the proportion of mutated genes appears differently between TP53WT and TP53MUT groups (in the mutation profile table). We performed the proportional test14 of the table to measure the significance of the proportional difference of overall mutation rates between A1 and A2. It resulted in p-value 0.01779. The mutation proportions were obtained from cBioPortal38. (c) Survival analysis of every gene according to its TP53 co-status in Group prevalent. In the TP53WT group, patients who had mutations of CTNNB1, SLITRK5 or NCOR2 showed better overall survival (OS) than others. In the TP53MUT group, a mutation in RYR1 affects OS. (d) Fisher’s exact tests and FDR multiple comparison corrections identify five genes significantly related to TP53 status in the Group prevalent, GPR112, MLL3, MTUS2, MYH6, and NRXN1, showing significant different proportions between TP53WT and TP53MUT groups. The adjusted p-values of the five genes are 0.140.

