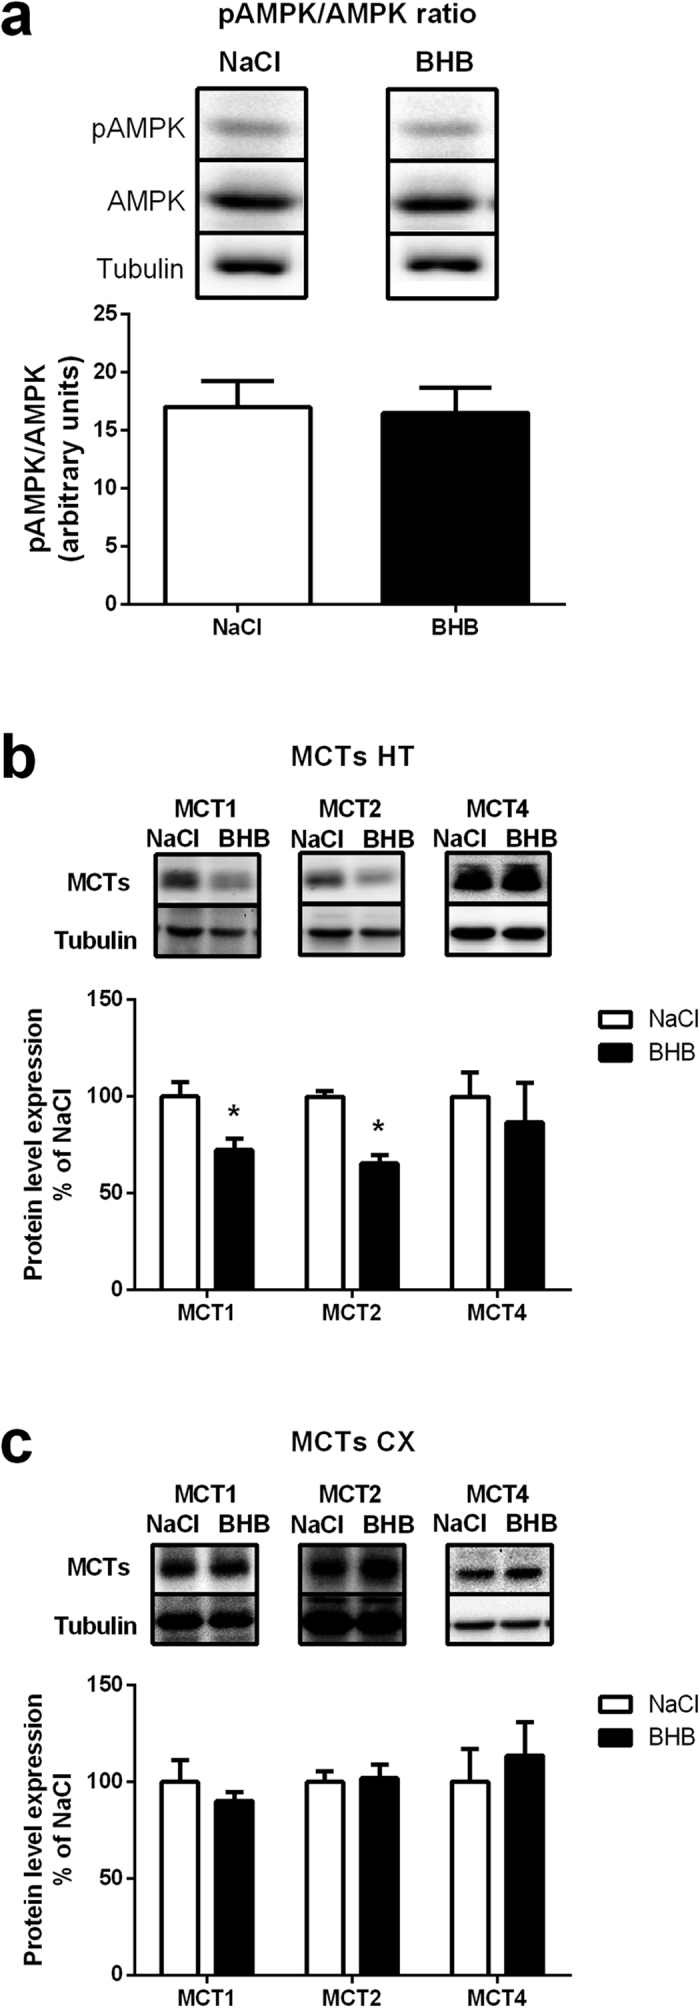
Figure 3. Hypothalamic pAMPK/AMPK ratio, as well as MCT1, MCT2 and MCT4 protein expression in the hypothalamus and cortex following intracarotid BHB infusion.

(a) Hypothalamic pAMPK/AMPK ratio at 24 h in mice infused with either NaCl or BHB. Upper panels are representative Western blots. Lower panel provides the quantification of protein expression and the resulting ratio (b) Hypothalamic MCT1, MCT2 and MCT4 protein expression at 24 h in mice infused with either NaCl or BHB. Upper panels are representative Western blots. Lower panel provides the quantification of protein expression (c) Cortical MCT1, MCT2 and MCT4 protein expression at 24 h in mice infused with either NaCl or BHB. Upper panels are representative Western blots. Lower panel provides the quantification of protein expression. MCT protein levels in BHB groups are expressed as percentage of the expression in the corresponding NaCl treated group (set at 100%). β-tubulin was used as internal reference. Data represent the mean ± SEM with n = 7 animals per condition and were statistically analyzed with unpaired Student t-test. *p < 0.05 vs. NaCl.
