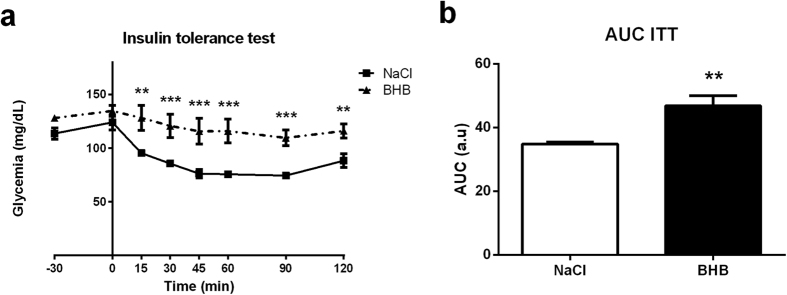
Figure 6. Effect of intracarotid BHB infusion on insulin tolerance.
(a) Intraperitoneal insulin tolerance test performed at 24 h of BHB infusion. (b) Area under curve of plasma glucose levels during the insulin tolerance test. Glycemia was measured during the 2 hours following an intraperitoneal load of insulin which stimulates glucose utilization. Data represent the mean ± SEM with n = 6 animals per condition and were statistically analyzed with a two-way ANOVA for (a) and an unpaired Student t-test for (b). *p < 0.05 vs. NaCl; **p < 0.01 vs. NaCl; ***p < 0.001 vs. NaCl. a.u., arbitrary units; AUC, area under the curve.

