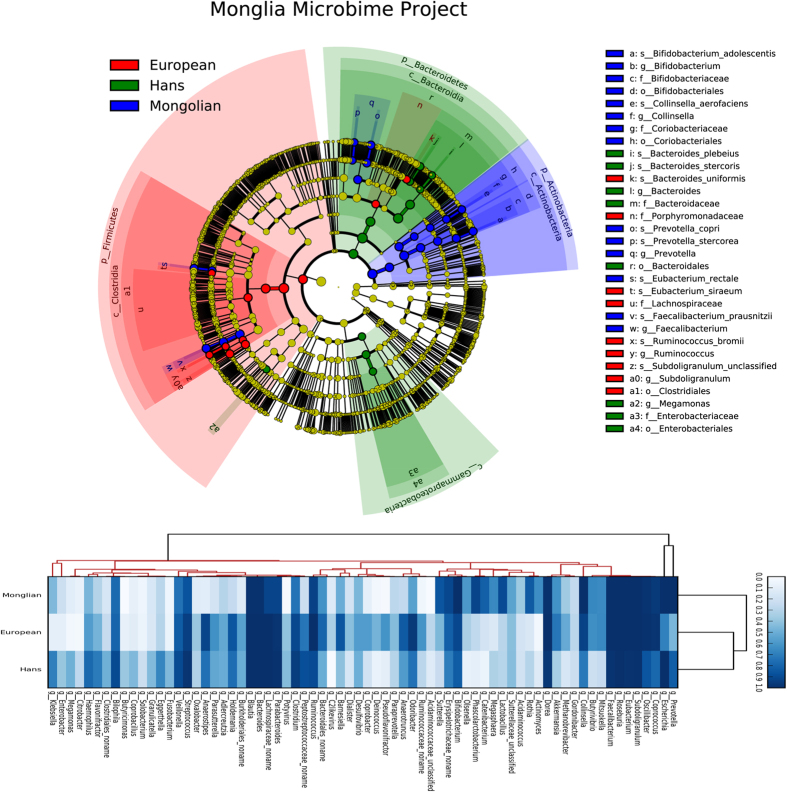
Figure 3. The Comparison of the Mongolian fecal microbiome project to others.
All samples data about the three groups (European, Mongolia and Hans) have been detection taxonomic information by use Metaphlan2 programme, the cladogram derived from LEfSe analysis (http://huttenhower.org/galaxy/), the heatmap is the detection frequency for the microbial taxa in all samples (100% is deepblue, 0% is blank).

