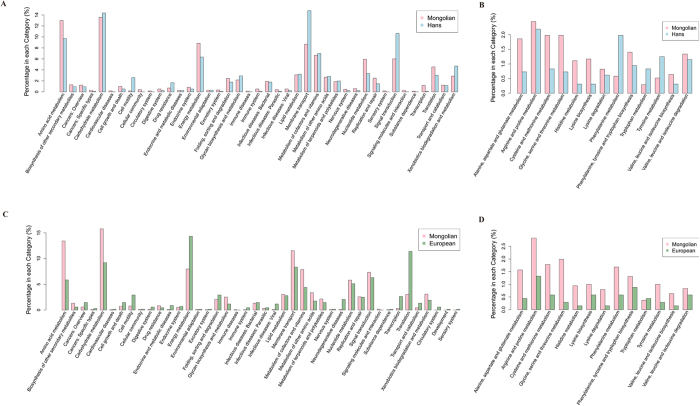
Figure 8. The distribution of KEGG functional categories of KO markers.
(A) Comparison between the Mongolians-enriched and the Hans-enriched KO markers on level 2 of KEGG functional category. (B) Comparison between the Mongolians-enriched and the Hans-enriched KO markers on pathways in “Amino acid metabolism”. (C) Comparison between the Mongolians-enriched and Europeans-enriched KO markers on level 2 of KEGG functional category. (D) Comparison between the Mongolians-enriched and Europeans-enriched KO markers on pathways in “Amino acid metabolism”.

