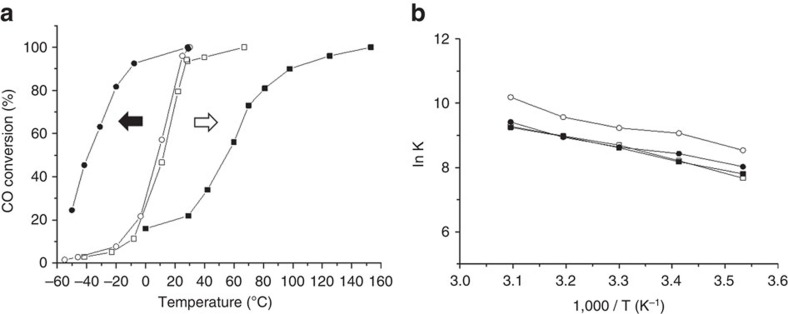
Figure 1. Diverging catalyst behaviour after heat treatment.
(a) CO conversion at various temperatures. Catalyst mass 150 mg, gas flow 50 ml min−1 1 vol% CO in air. (b) Arrhenius plots carried out at low conversion conditions. Empty circles (CP-1, dried, 6 wt% Au by ICP) filled circles (CP-1, calcined, 6 wt% Au by ICP) empty squares (CP-2, dried, 3.5 wt% Au by ICP) filled squares (CP-2, calcined, 3.5 wt% Au by ICP). The arrows shown in a represent the thermal activation behaviour (black arrow) of the CP-1 catalyst and the thermal deactivation behaviour (white arrow) of the CP-2 catalyst.

