
Figure 5. CSE kinetics in the presence of PAG followed by NMR and LC-MS.
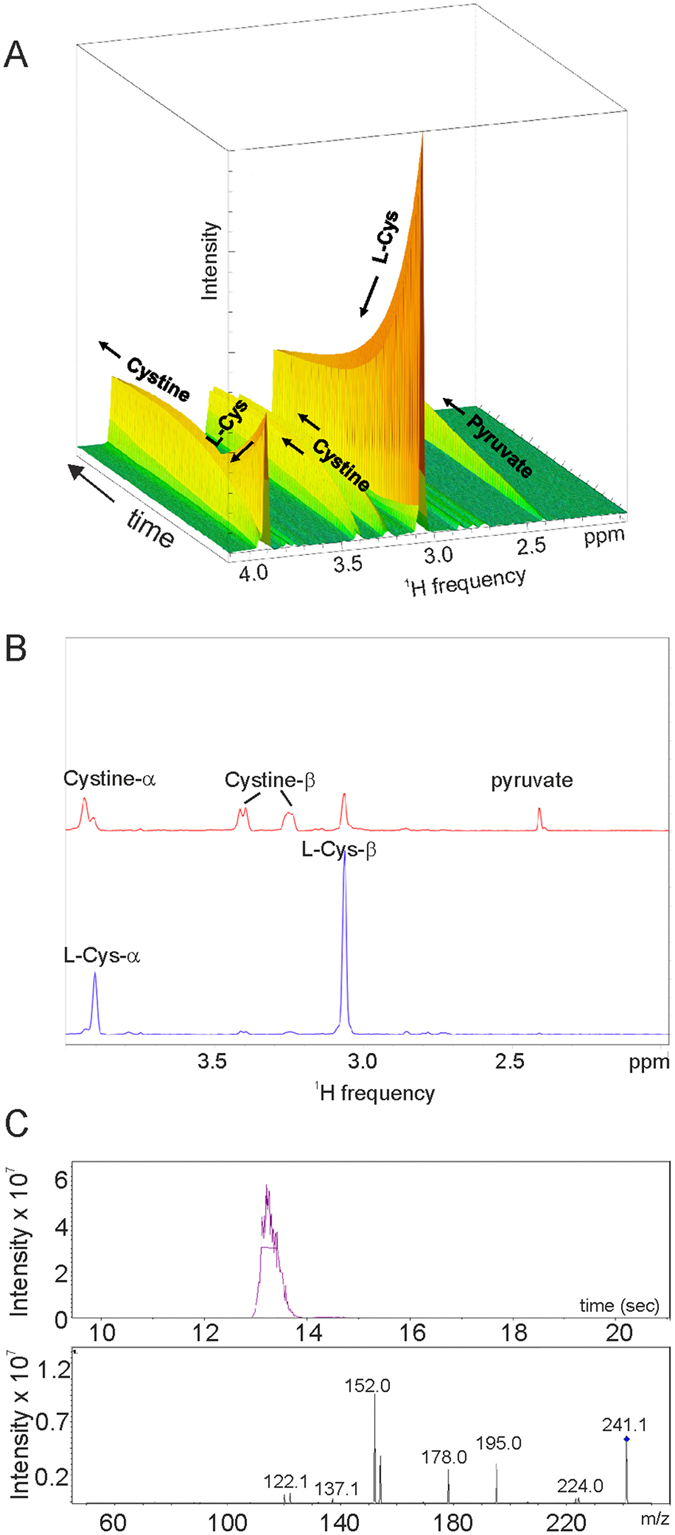
(A) The data are presented as pseudo 3D plots where the first increment of 13C HSQC spectra is plotted along the x (F2) and y axes and time is on the third axis as in Fig. 4. The concentration of PAG is 250 μM. (B) The first (blue) and last (red) increments of a 13C HSQC. The first spectrum was obtained ~2 min after the addition of the enzyme, and subsequently 59 spectra were collected over a 300 min period. The conditions used are the same as in Fig. 4. (C) Extracted ion chromatogram of CSE reaction mixture in the present of PAG at the end of the reaction, carried out for 60 minutes, by adding L-cysteine and incubating the mixture at 37 C. The chromatography was performed by monitoring the MS/MS transition 241.1−>152.0. The panel below the chromatogram reports the MS/MS fragmentation pattern of the peak at retention time of 13.5 min, which corresponds to cystine. The injection volumes were 10–20 μL for each sample.