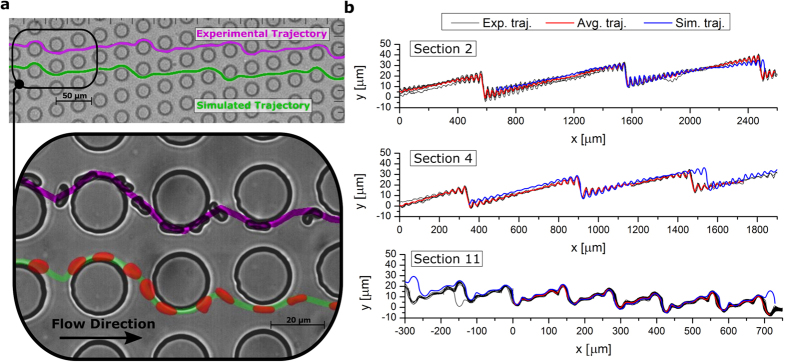
Figure 2. Experimental and simulated trajectories for RBCs at viscosity contrast C = 5.
(a) The trajectories of the experimental and simulated RBCs are obtained by following their center of mass through the pillar array. (b) Experimental and simulated RBC trajectories for several sections of the thick device. Black lines show multiple aligned experimental RBC trajectories and red lines correspond to average experimental trajectories. The blue lines show the RBC trajectories found in simulations. Section 2 shows an approximately neutral zig-zag mode, section 4 illustrates a positive zig-zag mode, and section 11 leads to a negative zig-zag mode.

