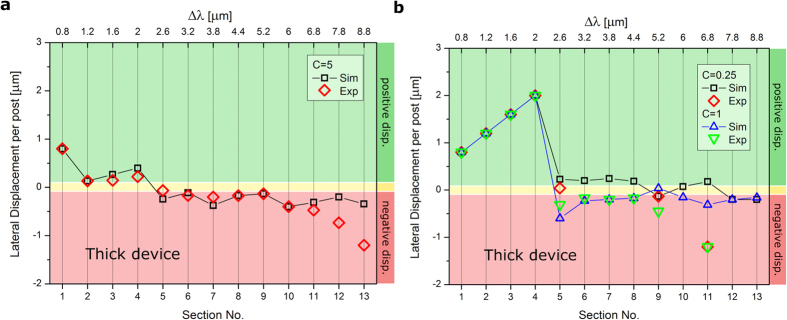
Figure 3. The average lateral displacement per post encounter l of RBCs in each individual section of the thick device at various viscosity contrasts C = ηi/ηo.
(a) Data for the thick device at C = 5. Experimental values agree well with the simulated values and the transition to zig-zag modes occurs between sections 1 and 2. (b) Data for the thick device at C = 1 and C = 0.25. Experimental and simulation trajectories at both viscosity contrasts undergo a transition from displacement to zig-zag modes between sections 4 and 5, which is later than found at a physiological value of C = 5.

