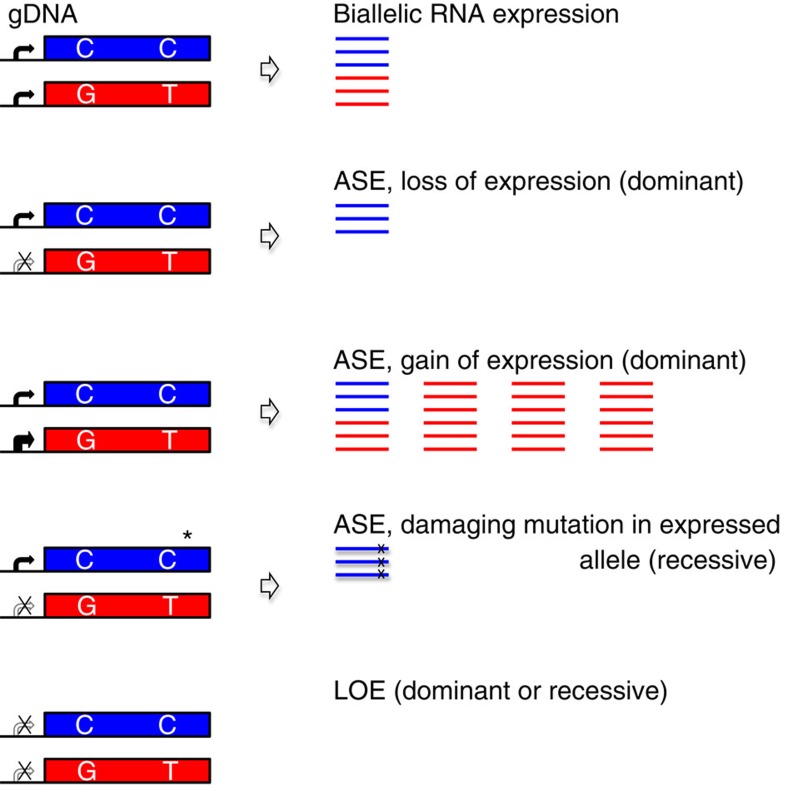
Figure 1. Identification of extreme ASE genes in subjects with CHD.
Shown are both alleles of a gene that differ by the SNP haploblocks ‘CC' (blue) and ‘GT' (red), as identified by WES, WGS or SNP-array genotyping. RNAseq analysis (read counts at heterozygous positions) reveals the expression of both alleles (biallelic RNA expression) or the disproportionate expression of one allele over another (ASE). RNAseq expression analyses (comparing each sample to the average of all other samples within a tissue group) identify relative loss and gain of expression. Variant analysis, in conjunction with RNAseq analysis, can further identify LOF mutations in the expressed allele (*).

