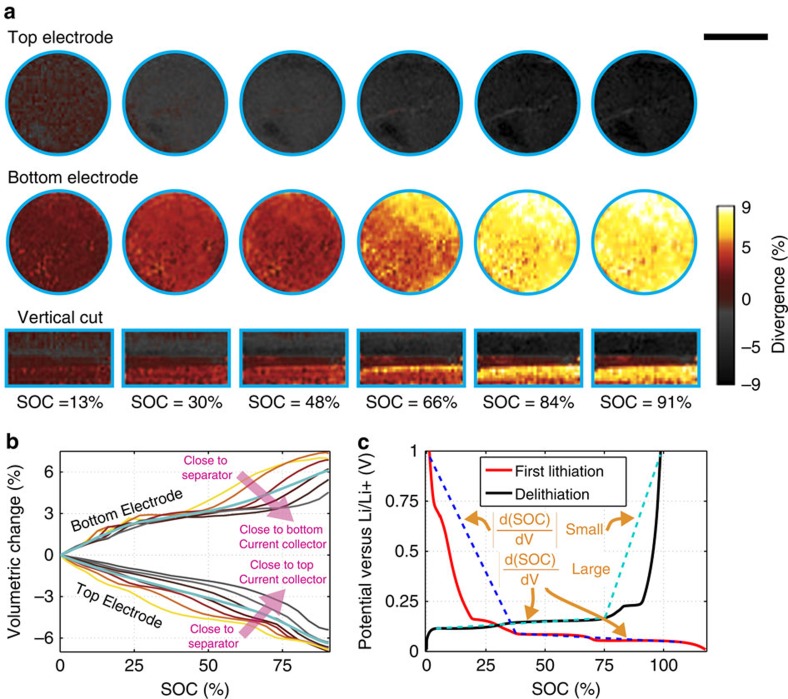
Figure 3. Divergence and strain.
(a) 3D divergence distribution in the electrodes computed from the displacement field correlating the scans at the indicated times with the first scan (that is, cumulative in time). Scale bar length, 1,000 μm. (b) 3D divergence integrated within cylindrical test volumes at various heights in the two electrodes as a function of flowed specific charge. The blue curves represent the average over the whole electrodes. (c) First electrochemical cycle of a graphite electrode cycled versus a metallic lithium electrode. The blue dashed lines indicate regimes in the charge- and discharge curves with different slopes.

