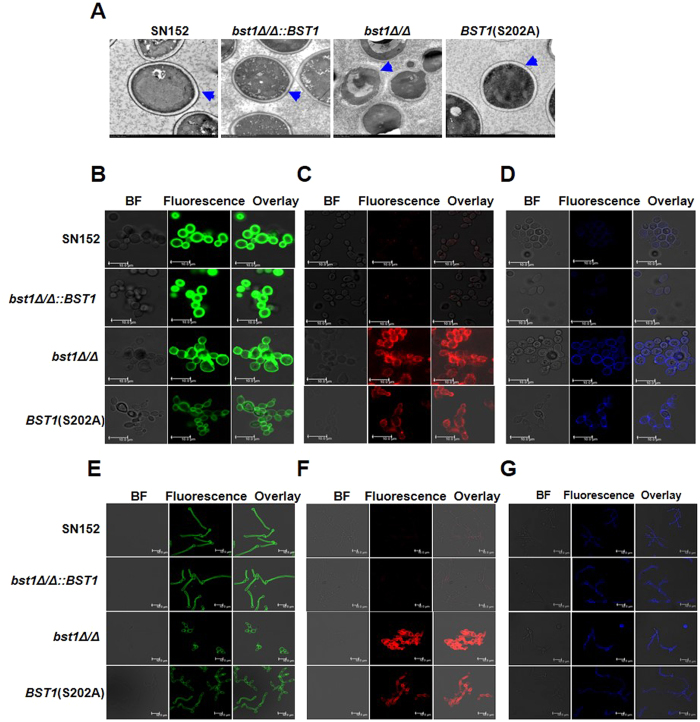
Figure 4. Deletion of BST1 results in altered cell wall polysaccharides.
(A) Representative micrographs of Transmission electron micrographs (TEM) of parent (SN152), BST1-complemented (bst1Δ/Δ::BST1), bst1Δ/Δ null mutant (bst1Δ/Δ), and BST1 S202A strains to evaluate their ultrastructure of cell wall. Blue arrows indicate the outer surface mannoprotein fibrils of the cell walls. (B–D) Fluorescence micrographs of three cell wall carbohydrate layers from exponentially growing parent (SN152), BST1-complemented (bst1Δ/Δ::BST1), bst1Δ/Δ null mutant (bst1Δ/Δ), and BST1 S202A strains, which were stained with ConA-FITC to visualize mannan (B), β-glucan antibody to visualize β-glucan (C) and CFW to visualize chitin (D). Scale bar represents 10 μm. (E–G) Fluorescence micrographs of three cell wall carbohydrate layers from the hyphal forms of parent (SN152), BST1-complemented (bst1Δ/Δ::BST1), bst1Δ/Δ null mutant (bst1Δ/Δ), and BST1 S202A mutant strains (Bst1 mutants displayed defective filamentation), which were stained with ConA-FITC to visualize mannan (E), β-glucan antibody to visualize β-glucan (F) and CFW to visualize chitin (G). Scale bar represents 10 μm.

