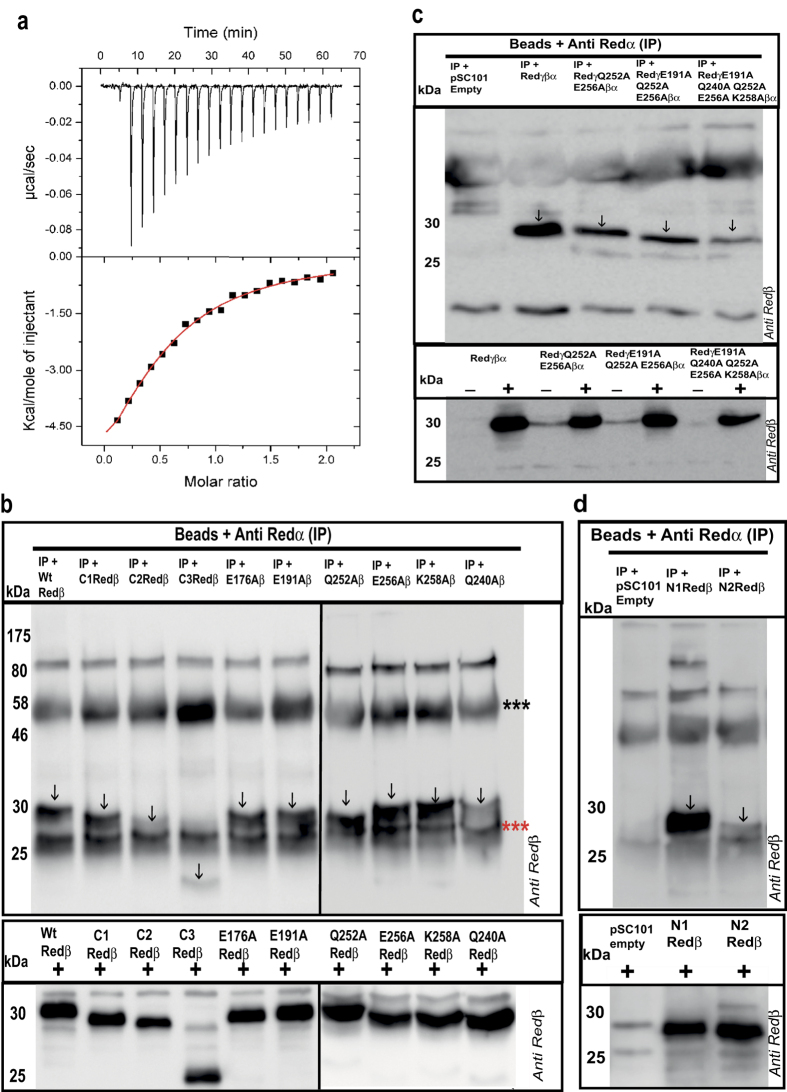
Figure 4. Evaluation of the Redα-Redβ interaction.
(a) Isothermal titration calorimetry determined by injecting Redα (2 μl; 150 μM; 3 minute intervals) into the cell containing Redβ (15 μM) and the resulting heat signal is plotted against time (upper panel) with the binding isotherm plotted in the lower panel including the theoretical fit to a single class of binding site (red line). (b) Upper panel: Co-IP of Redβ mutations using anti-Redα antibody. The Western blots of the immunoprecipitates were probed with anti-Redβ antibody. Vertical arrows indicate the Redβ protein. The three red and black asterisks indicate the immunoglobulin light and heavy chains respectively. Lower panel: Western blots showing the expression of different Redβ protein truncations and point mutants, which were used as input for the Co-IPs. (c) As for (b) except the left most lane on the upper panel shows a Co-IP from cells containing pSC101 without any inserted Red genes; and the lower panel shows Redβ protein expression without (−) and with (+) arabinose induction of Red protein expression. (d) As for (b,c). In accordance with journal policy, uncropped versions of these Western blots are presented in Supplementary Fig. 4.

