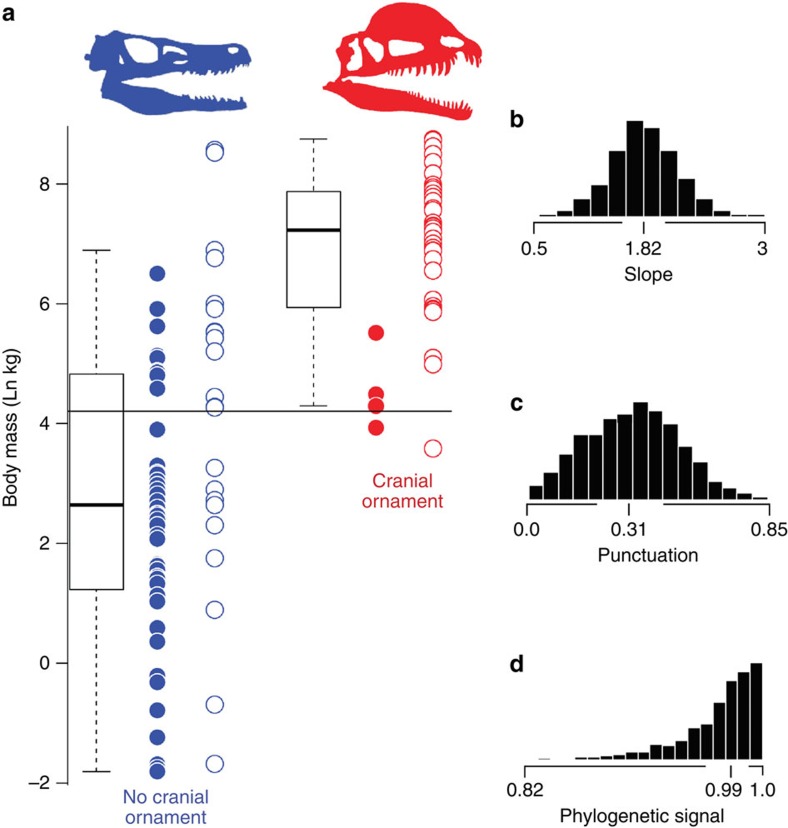
Figure 1. Phylogenetic t-test data distribution performed in BayesTraits.
(a) Blue data points represent unornamented theropods, red represents ornamented species, open circles are non-maniraptoriform theropods, whereas closed circles are species found within Maniraptoriformes, total sample size in phylogenetic t-test is 111 theropod species. Horizontal black line shows the mean loge body mass (4.207) among all theropods in the sample. Boxes within the box plot shows the first and third quartiles of the data; whiskers expand through the 95th quartile. The estimated posterior distribution for (b) slope, (c) punctuation and (d) phylogenetic signal shown on right.

