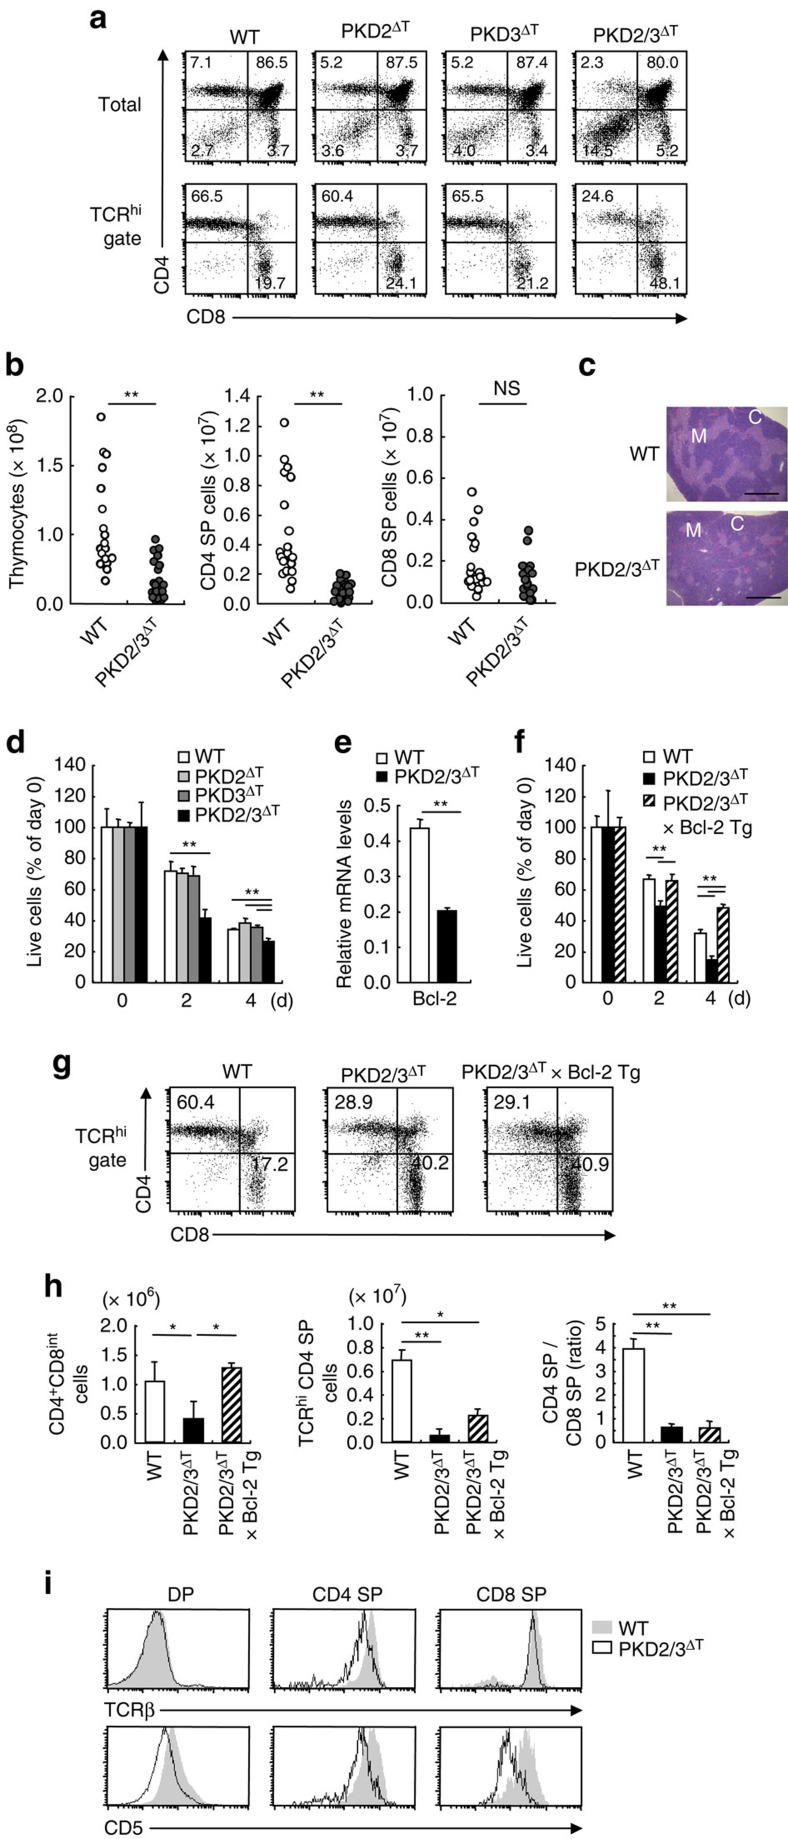
Figure 3. Defective T cell development in the absence of PKD.
(a) Total thymocytes (upper panels) and TCRβhi thymocytes (lower panels) from WT, PKD2fl/fl × Lck-Cre Tg (PKD2ΔT), PKD3fl/fl × Lck-Cre Tg (PKD3ΔT) and PKD2fl/fl × PKD3fl/fl × Lck-Cre Tg (PKD2/3ΔT) mice were analysed for CD4 and CD8 expression by flow cytometry. Numbers in quadrants indicate percentages. (b) Absolute cell numbers of total thymocytes, CD4 SP and CD8 SP subsets. Each symbol represents an individual mouse. **P<0.01, NS, not significant. (c) Hematoxylin and eosin staining of thymus sections. M, medulla; C, cortex. Scale bar, 1 mm. (d) In vitro survival of thymocytes. Total thymocytes from WT, PKD2ΔT, PKD3ΔT and PKD2/3ΔT mice were cultured in vitro and the live cell number of CD4 SP cells was analysed by staining with Annexin V and propidium iodide followed by flow cytometry analysis after the indicated numbers of days. **P<0.01. (e) Real time PCR analysis of Bcl-2 mRNA expression in CD4+CD8int thymocytes. Result is presented as expression relative to β-actin. **P<0.01. (f) Analysis of PKD2/3ΔT × Bcl-2 Tg mice. In vitro survival of thymocytes from WT, PKD2/3ΔT and PKD2/3ΔT × Bcl-2 Tg mice were analysed as in (d). **P<0.01. (g) Flow cytometry analysis of CD4 and CD8 expression on TCRβ+ thymocytes from WT, PKD2/3ΔT and PKD2/3ΔT × Bcl-2 Tg mice. (h) Average cell number of CD4+CD8int and CD4 SP thymocytes and the ratio of CD4 SP to CD8 SP thymocytes. *P<0.05, **P<0.01. (i) TCRβ and CD5 expression on DP and CD4 and CD8 SP thymocytes from WT (filled histograms) and PKD2/3ΔT mice (open histograms). Data are presented as mean±s.d. of triplicate assays (d–f) and eight mice (h) and are representative of five (a,i), three (c,f,g), four (d) and two (e) independent experiments. Unpaired two-tailed Student's t test is used to calculate P values.

