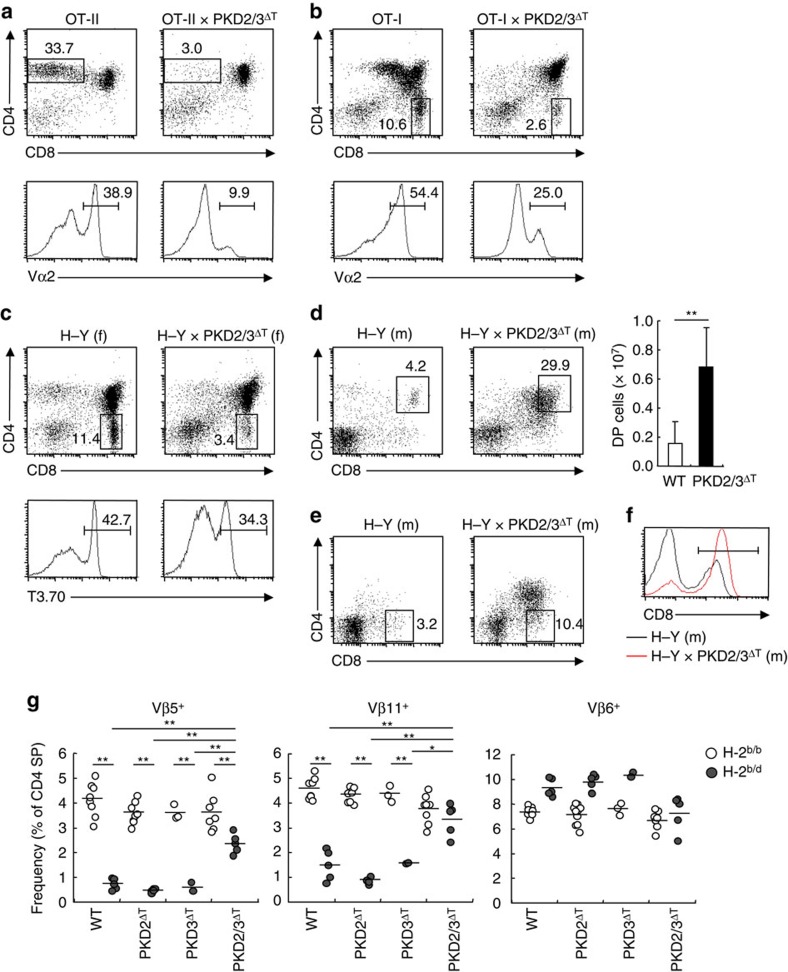
Figure 4. Impaired positive and negative selection in the absence of PKD.
(a,b) Thymocytes from WT and PKD2/3ΔT mice crossed with OT-II TCR Tg (a) or OT-I TCR Tg (b) were analysed for expression of CD4 and CD8 by flow cytometry. Numbers indicate the percentages of cells in each gate (upper panels). The percentage of Vα2+ cells is shown (lower panels). (c) Analysis of CD4 and CD8 expression (upper panels) and T3.70 expression (lower panels) of thymocytes from female (f) H–Y TCR Tg mice. (d) Analysis of male (m) H–Y TCR Tg mice (left panels). The average number of DP thymocytes is shown (bar graph). **P<0.01. (e) T3.70+ thymocytes from male H–Y TCR Tg mice were analysed for CD8 SP population. (f) T3.70+ splenocytes from male H–Y Tg and H–Y Tg × PKD2/3ΔT mice were analysed for CD8 expression. Mean fluorescent intensities (MFIs) of gated population are 208.41 and 337.32, respectively. (g) Negative selection induced by endogenous superantigens. Percentage of Vβ5+, Vβ11+ and Vβ6+ cells among CD4 SP thymocytes from B6 (H-2b) WT, PKD2ΔT, PKD3ΔT and PKD2/3ΔT mice, backcrossed (H-2b/d) or not (H-2b/b) onto B10.D2 (H-2d) mice was analysed by flow cytometry. Each circle represents an individual mouse. Small horizontal lines indicate the mean. *P<0.05, **P<0.01. Data are presented as mean±s.d. of eight mice (d, bar graph) and are representative of four independent experiments (a–f). Unpaired two-tailed Student's t test is used to calculate P values.

