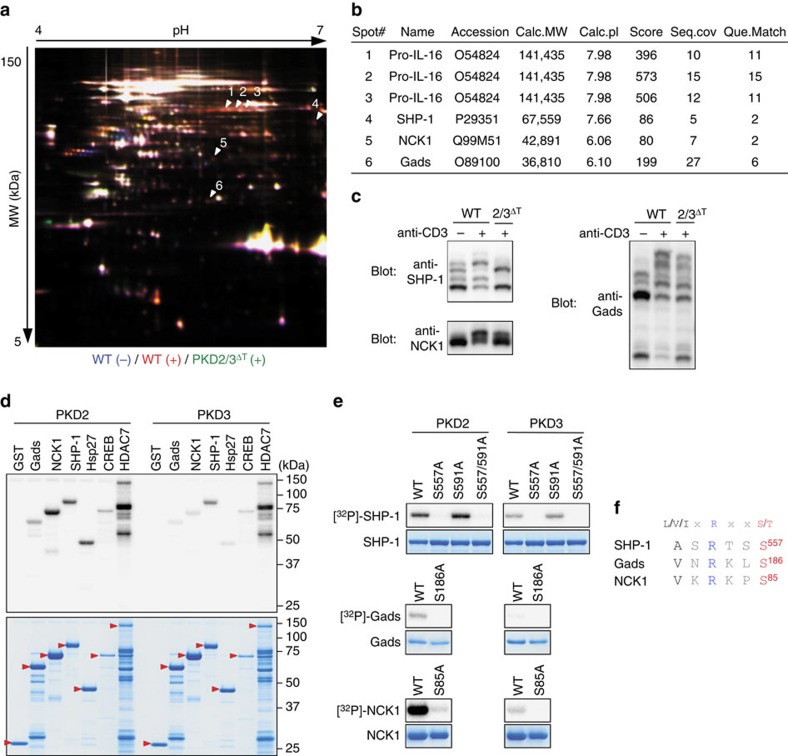
Figure 8. Identification of PKD2 and PKD3 substrates.
(a) A gel image of 2D-DIGE of phosphoproteins from unstimulated WT thymocytes (Cy2-labelled, blue), WT thymocytes stimulated by CD3 cross-linking (Cy3-labelled, red) and stimulated PKD2/3ΔT thymocytes (Cy5-labelled, green). Red spots are indicated by arrowheads as spot #1 to #6. (b) The summary of the protein identity, accession number, calculated molecular weight, calculated pI, Mascot score, sequence coverage and query match for each of six spots in a. Spots #1, #2 and #3, which have the same molecular weight with different pI's were identified as pro-IL-16. (c) Phos-tag immunoblot analysis of cell lysates from unstimulated- and TCR-stimulated-WT thymocytes for 2 min and stimulated PKD2/3ΔT thymocytes using anti-SHP-1, anti-NCK1 and anti-Gads. (d) In vitro kinase assays were performed in the presence of [γ-32P]ATP with active, recombinant PKD2 or PKD3 and GST-fused substrates as indicated (upper panel). CBB staining shows that equivalent amounts of proteins were used for the assays (lower panel). Red arrowheads indicate GST-fused substrates. (e) Identification of phosphorylation sites. In vitro kinase assays were performed with PKD2 or PKD3 and, as substrates, WT or mutant SHP-1, Gads and NCK1. Mutant substrates carry serine to alanine substitution at the indicated amino acid positions. CBB staining is shown as a loading control. (f) Comparison of the PKD consensus phosphorylation motif and phosphorylation sites identified in e. Data are representative of two independent experiments (a–e).

