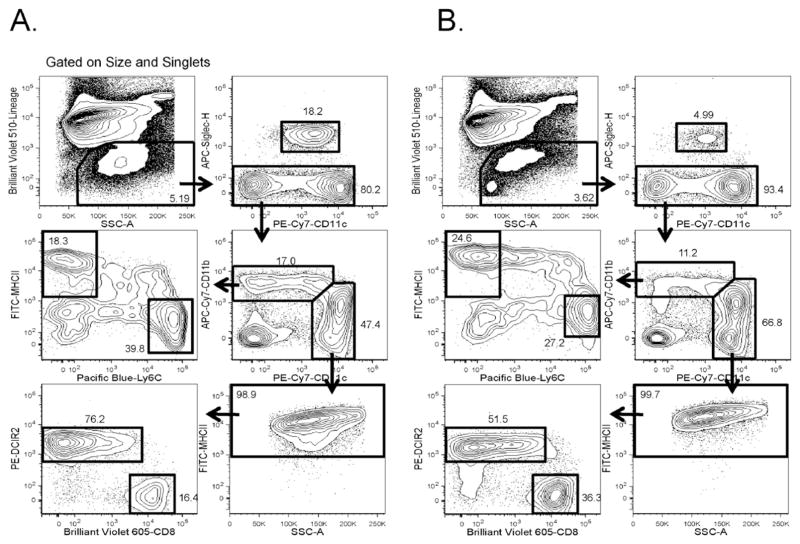
Fig. 2. Flow cytometry analysis of monocytic and DC spleen populations after CpG stimulation.
Splenocytes from 8–10 week old (A) NOD or (B) B6.g7 mice treated with CpG for 12 h. Splenocytes were then gated as described in Fig. 1 to identify monocytic and DC populations. Representative data shown from more than three independent experiments.

