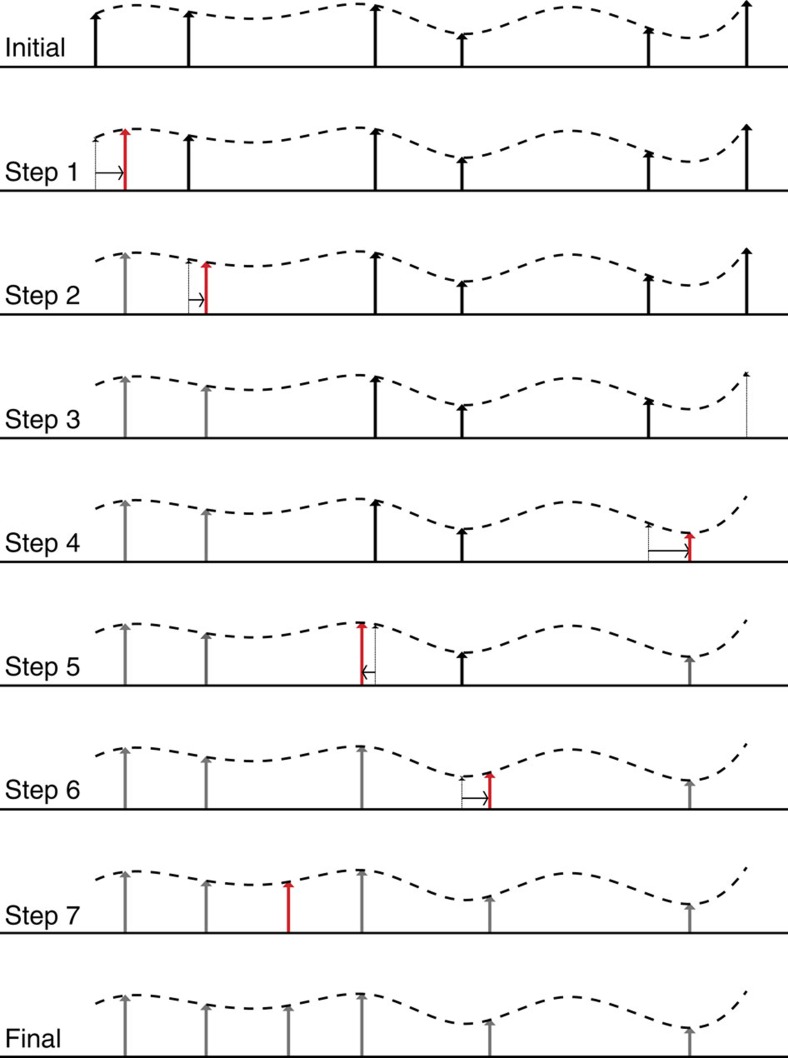
Figure 4. Illustration of the transformation cost time series method.
The true time series from which the two time series are sampled is indicated by the dashed line. The initial time series segment (top) is transformed into the final time series segment (bottom) in seven steps. Note that after seven steps the segment is identical to the final target time series. The steps 1, 2, 4, 5, 6 are combinations of the elementary operations (i) time shift and (ii) adjusting the amplitude (first two terms of equation (3)), while in step 3 one event is deleted and therefore the (iii) elementary operation was applied (last term of equation (3)).

