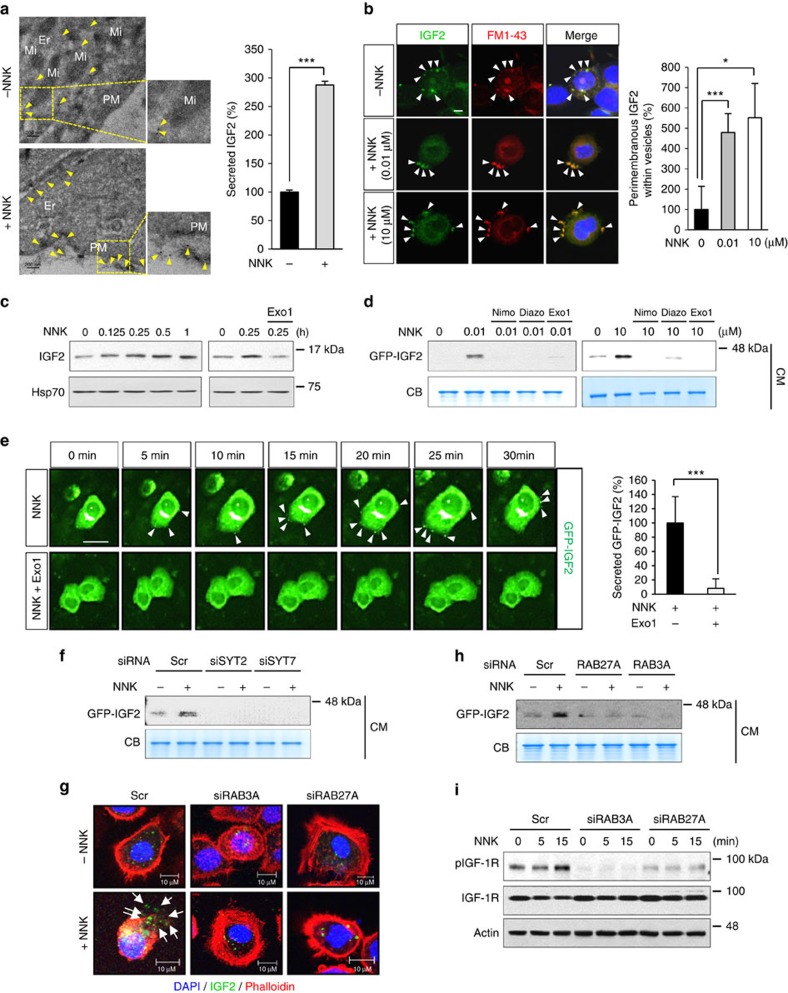
Figure 4. NNK-induced IGF2 secretion by regulated exocytosis.
(a) Immuno-EM analysis of IGF2 localization in HBEL/p53i cells exposed to NNK (10 μM) for 30 min. Yellow arrow indicates the IGF2 localization (left). The secreted IGF2 was quantified and normalized to untreated with NNK as a percentage in the graph (right). Er, endoplasmic reticulum; Mi, mitochondria; PM, plasma membrane. Scale bar, 200 nm. (b) Confocal images of IGF2 (green), FM1-43 (red), and DAPI (blue) in HBEL/p53i cells stimulated with NNK for 15 min. White arrows indicate perimembranous IGF2 within vesicles. Graph shows the quantitative analyses of perimembranous IGF2 within vesicles per field. Scale bar, 5 μm. (c) BEAS-2B cells were exposed to NNK for the indicated times (left) or stimulated with NNK for 15 min with or without pretreatment with Exo1 for 3 h (right). Vesicles containing IGF2 were isolated by differential centrifugation, and IGF2 levels were determined by western blot (WB) analysis. Hsp70 was used as the loading control. (d) BEAS-2B/GFP-IGF2 cells were pretreated with the indicated inhibitors for 3 h, and then stimulated with NNK for 15 min. CM from these cells were subjected to WB analysis. Nimo: nimodipine; Diazo: diazoxide. (e) Left: BEAS-2B/GFP-IGF2 cells were pretreated with Exo1 for 3 h and then stimulated with NNK. A time-lapse imaging analysis was performed. White arrows indicate secreted GFP-IGF2. Right: secreted GFP-IGF2 out of 25 BEAS-2B cells treated with NNK or NNK and Exo1 at 30 min after NNK treatment was quantified using Harmony high content imaging and analysis software. Scale bar, 20 μm. (f,h,i) BEAS-2B/GFP-IGF2 cells were transfected with siRNAs targeting indicated genes, and then stimulated with NNK for 15 min. CM or WCL from these cells were subjected to WB analysis. (g) Confocal images of IGF2 (green), phalloidin (red) and DAPI (blue) in HBEL/p53i cells transfected with the indicated siRNAs and then treated with NNK for 15 min. White arrow indicates the secreted IGF2. Scale bar, 10 μm. Data are presented as the mean±s.d. Statistical significance was determined by Student's t-test. *P<0.05; ***P<0.001.

