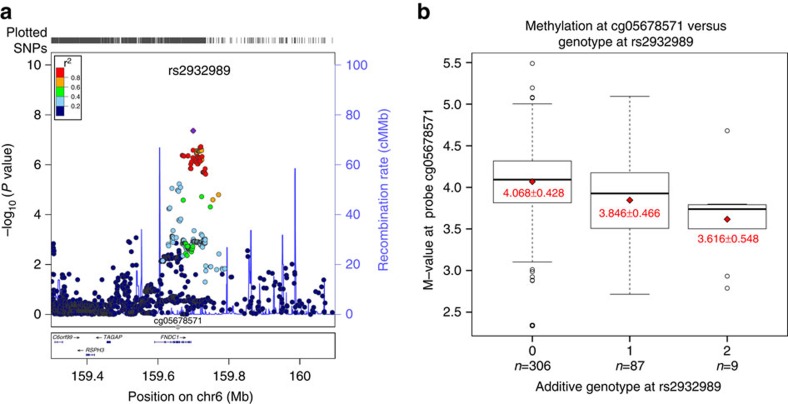
Figure 1. The association statistics of locus 6q25.3 with acute otitis media and correlation with methylation status in gene FNDC1.
(a) The regional association plot at locus 6q25.3. The SNP chromosomal location on genome build hg19 is indicated on the x axis and the negative log10 of P value for each SNP is plotted on the left-hand y axis. Association statistics were from the meta-analysis of the two cohorts in the discovery phase. The most associated SNP (rs2932989) is shown as purple dot and the other SNPs including both genotyped SNPs and imputed SNPs are coloured according to their linkage disequilibrium with SNP rs2932989. The recombination rates are shown as blue lines. The plot was generated with software LocusZoom70. The position of the methylation probe cg05678571 is indicated by a grey dot. (b) M-values for methylation probe cg05678571 are plotted against the additive genotype at SNP rs2932989. Dark horizontal lines in the boxplots represent the median of the group, the boxes represent the 25–75% quantiles, and the whiskers of the boxplot extend beyond those quartiles to 1.5 times the interquartile range. Data outside those ranges are represented by points (open circles). Red diamonds indicate the means of each group, and the red text is the mean±s.d. of each group. The number of individuals with each additive genotype of minor allele T is indicated below the x axis.

