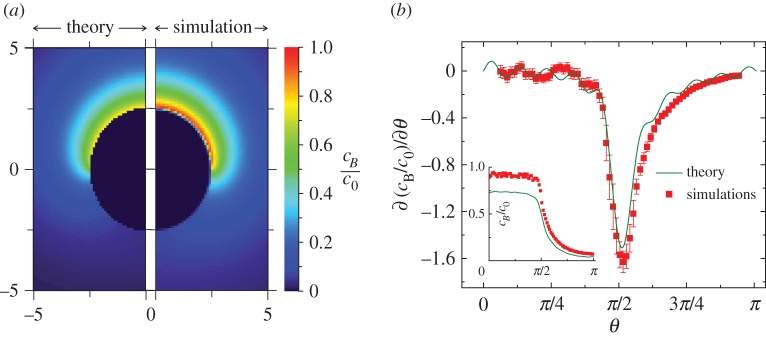
Figure 2.
(a) Normalized concentration fields cB/c0 in the xz plane (y=0); continuum theory (left) and microscopic simulation (right). The upper hemisphere is the catalytic and the lower hemisphere is non-catalytic. (b) Quantitative comparison of concentration gradients near the edge of the boundary layer. The normalized concentration gradients ∂(cB/c0)/∂θ are plotted as a function of the polar angle θ. The solid green line is the continuum theory and the red squares are microscopic simulations. The inset shows the normalized concentration cB/c0 versus the angle θ.

