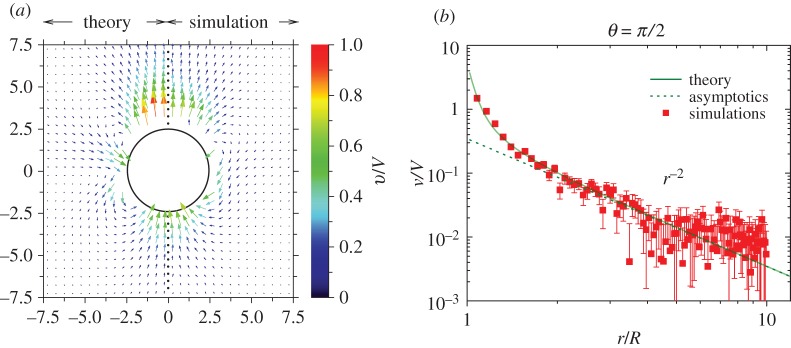
Figure 4.
(a) Fluid velocity field: continuum theory (left) and microscopic simulations (right). The fluid velocity v is scaled by the propulsion velocity V (V T for the continuum theory and by V S for the microscopic simulations). (b) Magnitude of fluid velocity as a function of distance r along the θ=π/2 direction from the centre of the motor. The solid green line is continuum theory, the dotted green line is the asymptotic value and the red squares are microscopic simulations. The 1/r2 power-law decay of velocity field is captured in the microscopic simulations. The radius of the motor is R=2.5.

