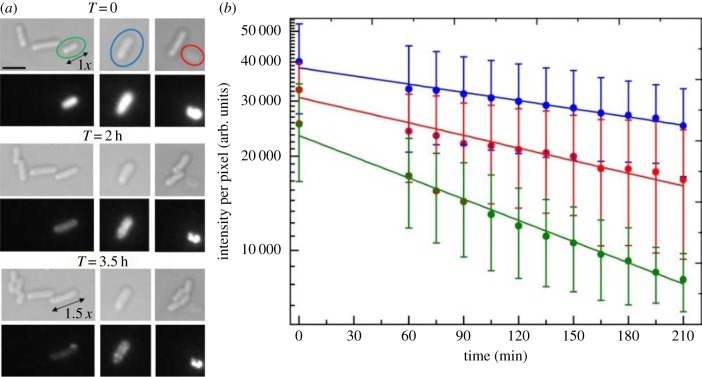
Figure 3.
(a) Electrocompetent E. coli RP437, FliCst cells electroporated with 0.85 µM, i.e. 17 pmols, CheY(Cys)-Cy3B imaged in bright-field (top panels) and in fluorescence (bottom panels) during a 3.5 h time-lapse experiment on rich medium agarose pad. In the first field of view, a cell that has uptaken some fluorescence (green oval) and which increases its size 1.5× by the end of the acquisition is shown. In the second field of view a fluorescent cell that does not grow but remains intact at least until the end of the acquisition, without showing any evident sign of membrane degradation, is shown (blue oval). Finally, in the last field of view, a growing/dividing fluorescent cell (green oval) is shown. (b) Average fluorescence decay curves on a logarithmic scale over time for eight growing/dividing (green), four non-growing but intact (blue) and four damaged (red) imaged cells. The single-exponential fit in green yields τ = (150 ± 5) min (i.e. approx. 2.5 h) for growing/dividing cells, the fit in blue yields τ = (400 ± 20) min (i.e. just over 6.5 h) for non-growing but intact cells, and the fit in red yields τ = (260 ± 20) min (i.e. just over 4 h) for damaged cells. Single molecules start being distinguishable in the cells from T = 3 h onwards. Settings for Cy3B: epifluorescence, exposure time 800 ms. Scale bar, 3 µm (applies to all bright-field and fluorescence images).

