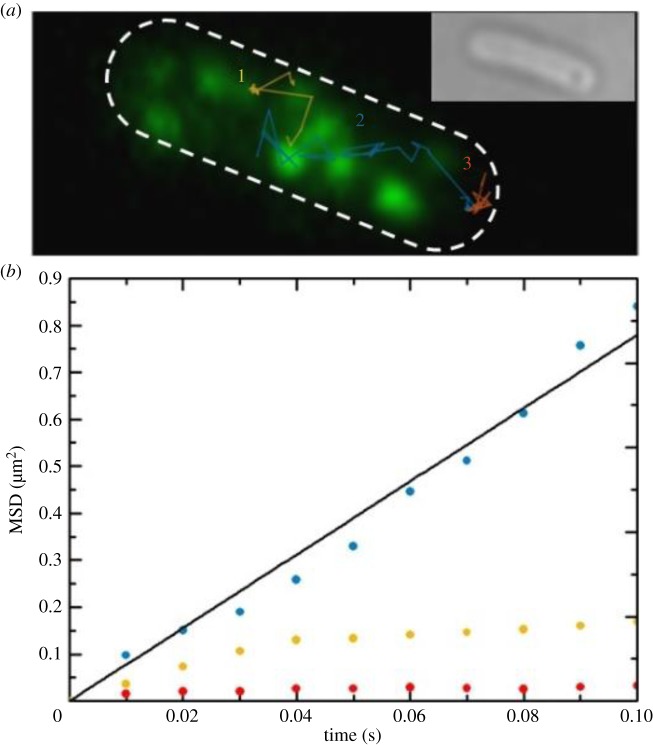
Figure 9.
(a) Green fluorescent channel image of the same E. coli RP437 (FliM-YPet, FliCst) electrocompetent cell shown in figure 8a electroporated with 20 nM Atto647-(Cys)CheY with its outline in white (dashed line). Three example CheY tracks are superimposed, corresponding to the two main behaviours observed: bound to a locus in the cell which could be a motor (1, orange) and to another unlabelled locus which could be a polar cluster (3, red), or free diffusing in the cytoplasm (2, blue). The inset shows the cell in bright-field. For aesthetic reasons, in this figure the green fluorescence was smoothed by bicubic interpolation, with the output pixel value a weighted average of pixels in the nearest 4 × 4 neighbourhood. Settings: exposure time 10 ms, intensity used for YPet: 400 nW µm−2; intensity used for Atto647: 1 µW µm−2. (b) Mean squared displacement (MSD) curves versus elapsed time over 10 frames (100 ms) for each of the tracks in (a) (colours matching tracks). Track 2 (blue) is fit with a straight line through the origin (black), consistent with free diffusion of Atto647-(Cys)CheY at 1.95 ± 0.05 µm2 s−1.

