
Figure 1.
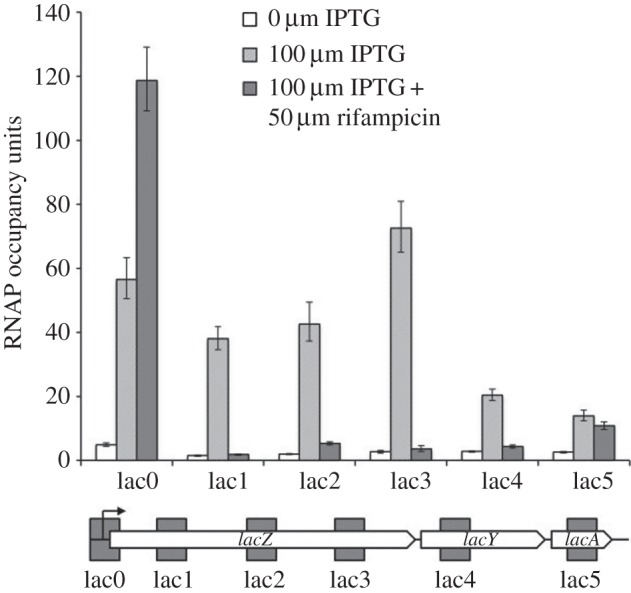
RNAP flux through the lac operon on the E. coli MG1655 chromosome. The figure shows experimentally measured RNAP occupancies at the lac promoter region (denoted lac0), or downstream regions (denoted lac1–5), illustrated in the sketch of the operon (approximately to scale). The probes are located from position −147 to +123 (lac0), position +518 to +781 (lac1), position +1421 to +1686 (lac2), position +2308 to +2575 (lac3), position +3691 to 3949 (lac4) and position +4654 to 4916 (lac5), all positions being with respect to the lac operon transcript start site. Cell cultures were grown and treated with formaldehyde, as described in the Material and methods section. Total DNA with cross-linked proteins was extracted and sonicated, and fragments cross-linked to RNAP were purified by immunoprecipitation. RNAP occupancy was measured by a ChIP–qPCR protocol. The figure illustrates measurements from cells grown with or without the inducer IPTG and with or without rifampicin, as indicated by the different shadings.