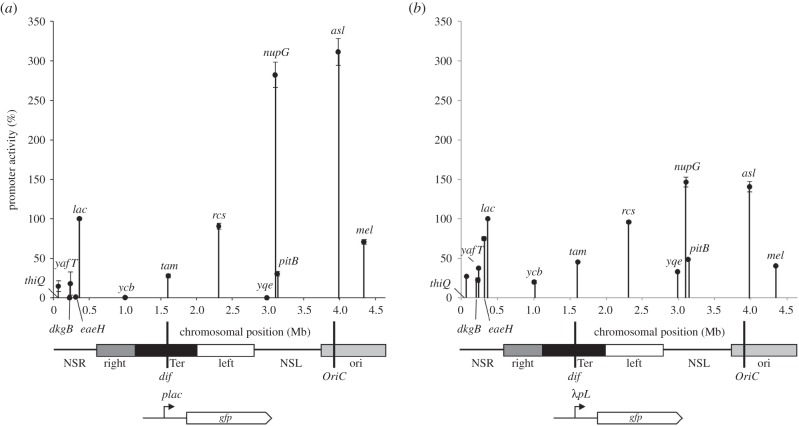
Figure 2.
Chromosome position effects on activities of the lac (a) and λpL (b) promoters. The figure shows experimentally determined measurements of the expression of lac and λpL promoter::gfp fusions, at different locations on the E. coli chromosome. Fluorescent output from the reporter cassette was measured during growth in the presence of 100 µM IPTG, and is represented on the y-axis. Chromosomal positions of the reporter cassette are represented on the x-axis and denoted in the figure by the name of a neighbouring gene. Below each chart is a linear schematic of the E. coli genome, with the origin of replication (OriC), terminus (dif), macrodomains and non-structured regions (NSR, right, Ter, left, NSL, ori) shown as previously reported [30].

