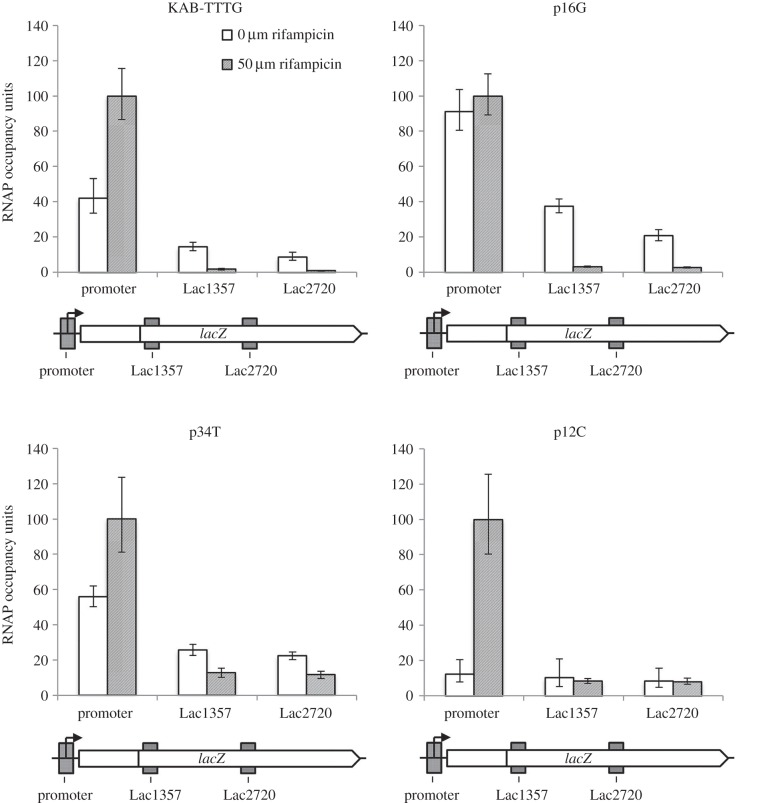
Figure 3.
RNAP flux through the lac operon controlled by synthetic promoters. The figure shows experimentally determined levels of RNAP occupancy at the promoter and downstream regions Lac1357 and Lac2720, measured by ChIP–qPCR, during exponential growth in the presence of absence of rifampicin, as indicated by the different shading. The positions of probe regions are shown on the schematic diagrams (approximately to scale). RNAP occupancy of each promoter in the presence of rifampicin is taken as 100% occupied and other figures normalized accordingly. Data are shown for the KAB-TTTG promoter and three mutant derivatives: p16G (an extended −10 element ‘up’ mutant), p34T (a −35 element ‘up’ mutant) and p12C (a −10 element ‘down’ mutant).

