
Figure 2.
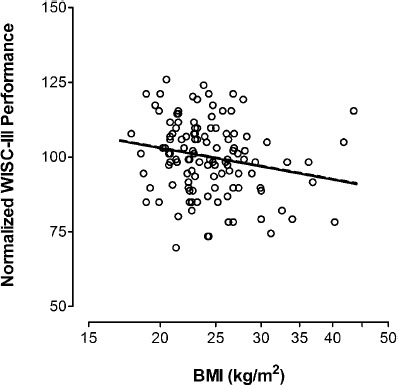
Normalized Wechsler Intelligence Scale for Children, 3rd edition (WISC-III) performance subscale IQ scores at age 8.1 (0.6) years among 118 children in Dataset B (vertical axis), plotted against their mothers’ body mass index (BMI) during the second trimester (horizontal axis). The BSID-III language scores were normalized to 100, by dividing each result by the overall mean of 104.8. The solid line shows the unadjusted relationship (r = -0.20, slope = -34.733, P = 0.028), while the dashed line shows the relationship after adjusting for Hollingshead score (hhs), child's sex, number of prior births (npb), mother's age and smoking (r = -0.20, slope = -35.534, P = 0.023). The adjustment equation for the expected WISC-III performance subscale IQ scores is shown below. Expected Score = 131.633 -35.534 × log(bmi) + 3.843 × hhs + 2.544 × sex -1.149 × npb + 0.147 × age + 1.391 × smoke