
Table 2.
Dataset A: Maternal and offspring data stratified by World Health Organization (WHO) BMI category
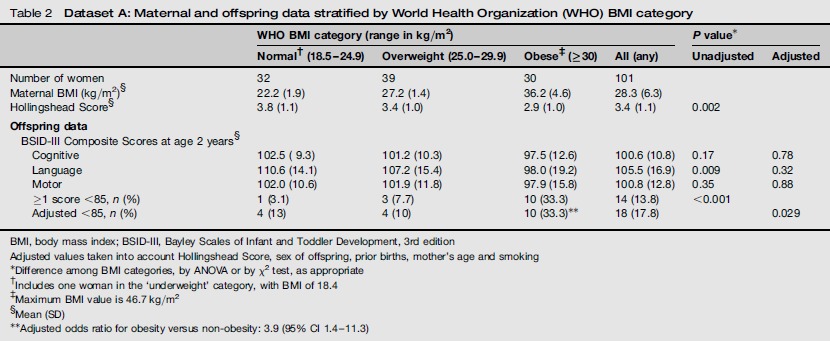
| WHO BMI category (range in kg/m2) |
P value* |
|||||
|---|---|---|---|---|---|---|
| Normal† (18.5-24.9) | Overweight (25.0-29.9) | Obese‡ (≥30) | All (any) | Unadjusted | Adjusted | |
| Number of women | 32 | 39 | 30 | 101 | ||
| Maternal BMI (kg/m2)§ | 22.2 (1.9) | 27.2 (1.4) | 36.2 (4.6) | 28.3 (6.3) | ||
| Hollingshead Score§ | 3.8 (1.1) | 3.4 (1.0) | 2.9 (1.0) | 3.4 (1.1) | 0.002 | |
| Offspring data | ||||||
| BSID-III Composite Scores at age 2 years§ | ||||||
| Cognitive | 102.5 (9.3) | 101.2 (10.3) | 97.5 (12.6) | 100.6 (10.8) | 0.17 | 0.78 |
| Language | 110.6 (14.1) | 107.2 (15.4) | 98.0 (19.2) | 105.5 (16.9) | 0.009 | 0.32 |
| Motor | 102.0 (10.6) | 101.9 (11.8) | 97.9 (15.8) | 100.8 (12.8) | 0.35 | 0.88 |
| ≥1 score <85, n (%) | 1 (3.1) | 3 (7.7) | 10 (33.3) | 14 (13.8) | <0.001 | |
| Adjusted <85, n (%) | 4 (13) | 4 (10) | 10 (33.3)** | 18 (17.8) | 0.029 | |
BMI, body mass index; BSID-III, Bayley Scales of Infant and Toddler Development, 3rd edition
Adjusted values taken into account Hollingshead Score, sex of offspring, prior births, mother's age and smoking
*
Difference among BMI categories, by ANOVA or by χ2 test, as appropriate
†
Includes one woman in the ‘underweight’ category, with BMI of 18.4
‡
Maximum BMI value is 46.7 kg/m2
§
Mean (SD)
**
Adjusted odds ratio for obesity versus non-obesity: 3.9 (95% CI 1.4-11.3)