
Table 3.
Dataset B: Maternal and offspring data stratified by World Health Organization (WHO) BMI category
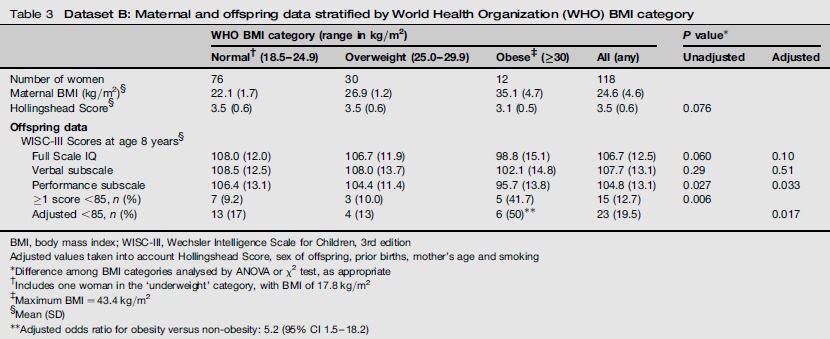
| WHO BMI category (range in kg/m2) |
P value* |
|||||
|---|---|---|---|---|---|---|
| Normal† (18.5-24.9) | Overweight (25.0-29.9) | Obese‡ (≥30) | All (any) | Unadjusted | Adjusted | |
| Number of women | 76 | 30 | 12 | 118 | ||
| Maternal BMI (kg/m2)§ | 22.1 (1.7) | 26.9 (1.2) | 35.1 (4.7) | 24.6 (4.6) | ||
| Hollingshead Score§ | 3.5 (0.6) | 3.5 (0.6) | 3.1 (0.5) | 3.5 (0.6) | 0.076 | |
| Offspring data | ||||||
| WISC-III Scores at age 8 years§ | ||||||
| Full Scale IQ | 108.0 (12.0) | 106.7 (11.9) | 98.8 (15.1) | 106.7 (12.5) | 0.060 | 0.10 |
| Verbal subscale | 108.5 (12.5) | 108.0 (13.7) | 102.1 (14.8) | 107.7 (13.1) | 0.29 | 0.51 |
| Performance subscale | 106.4 (13.1) | 104.4 (11.4) | 95.7 (13.8) | 104.8 (13.1) | 0.027 | 0.033 |
| ≥1 score <85, n (%) | 7 (9.2) | 3 (10.0) | 5 (41.7) | 15 (12.7) | 0.006 | |
| Adjusted <85, n (%) | 13 (17) | 4 (13) | 6 (50)** | 23 (19.5) | 0.017 | |
BMI, body mass index; WISC-III, Wechsler Intelligence Scale for Children, 3rd edition
Adjusted values taken into account Hollingshead Score, sex of offspring, prior births, mother's age and smoking
*
Difference among BMI categories analysed by ANOVA or χ2 test, as appropriate
†
Includes one woman in the ‘underweight’ category, with BMI of 17.8 kg/m2
‡
Maximum BMI = 43.4 kg/m2
§
Mean (SD)
**
Adjusted odds ratio for obesity versus non-obesity: 5.2 (95% CI 1.5-18.2)