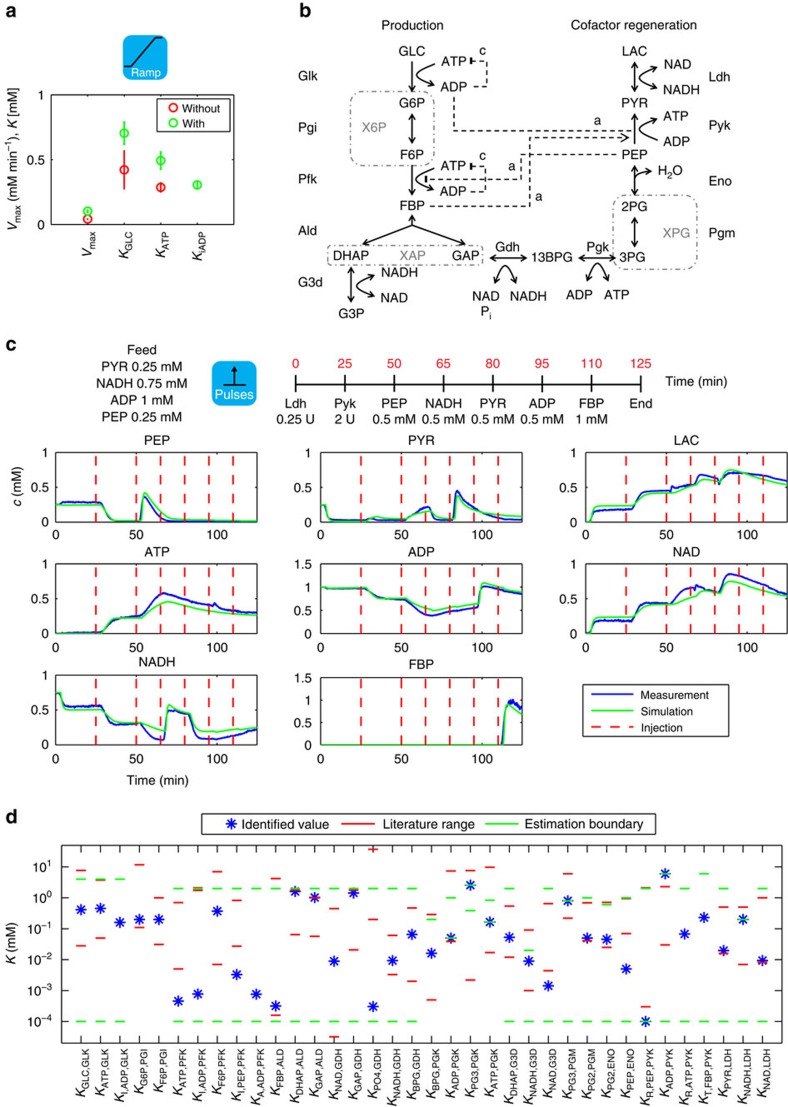
Figure 2. Model identification.
(a) Structural identification of the reaction mechanism of Glk. Displayed is on the top a schematic of the type of experiment used for identification. The data were used to estimate the parameters of two different rate equations for Glk, once excluding (red symbols) and once including (green symbols) a term for ADP inhibition. We carried out for each model 100 independent parameter estimation runs and show the obtained s.d.'s for the parameter estimation, which suggest the requirement for an ADP inhibition term. (b) Enzymatic cascade reaction for the production of DHAP. Note the simulated consumption reaction for DHAP by G3d-catalysed conversion to G3P. Stippled arrows: enzyme activation. Blunt stippled lines: enzyme inhibition (c, competitive; a, allosteric). Stippled boxes: isomers whose concentrations were measured as pool. Abbreviations from Supplementary Table 1. (c) Typical parameter estimation experiment from the lower part of glycolysis (experiment E3 of Supplementary Table 12). Upper panel: summary of starting conditions and interventions during experiment. Units refer to the absolute amount of enzyme added at a given time, concentrations to expected concentration changes. Lower panel: blue, measured concentrations; green, simulation. (d) Affinity parameters with best estimate as blue star, estimation boundaries (green) and range of parameters mentioned in the literature (red).

