Fig. 1.

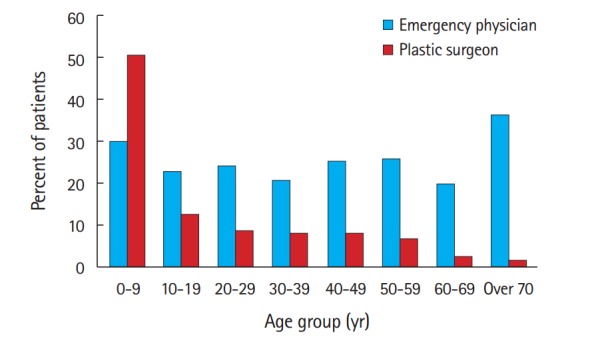
The proportion of patients receiving surgical treatment by specialty in each age group. All P-values for differences in each age group was less than 0.05.

The proportion of patients receiving surgical treatment by specialty in each age group. All P-values for differences in each age group was less than 0.05.