. 2015 Dec 28;2(4):236–243. doi: 10.15441/ceem.15.085
Copyright © 2015 The Korean Society of Emergency Medicine
This is an Open Access article distributed under the terms of the Creative Commons Attribution Non-Commercial License (http://creativecommons.org/licenses/by-nc/3.0/).
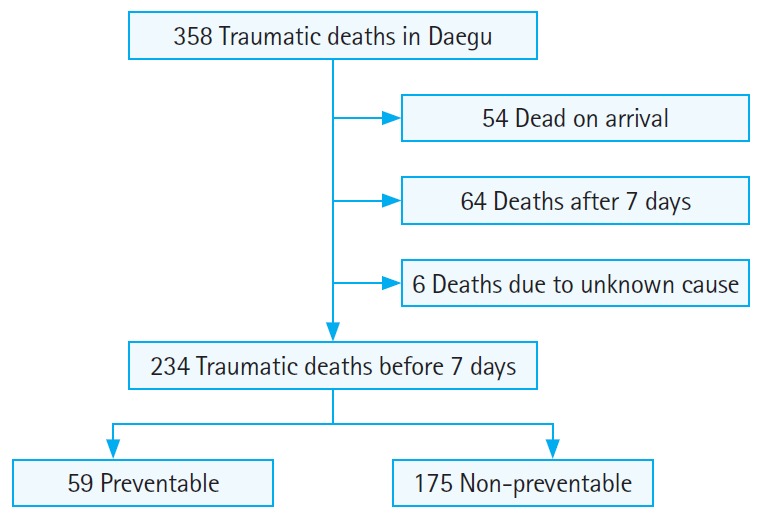
Fig. 1.

Preventable death rate study flow diagram.
