
Fig. 2.
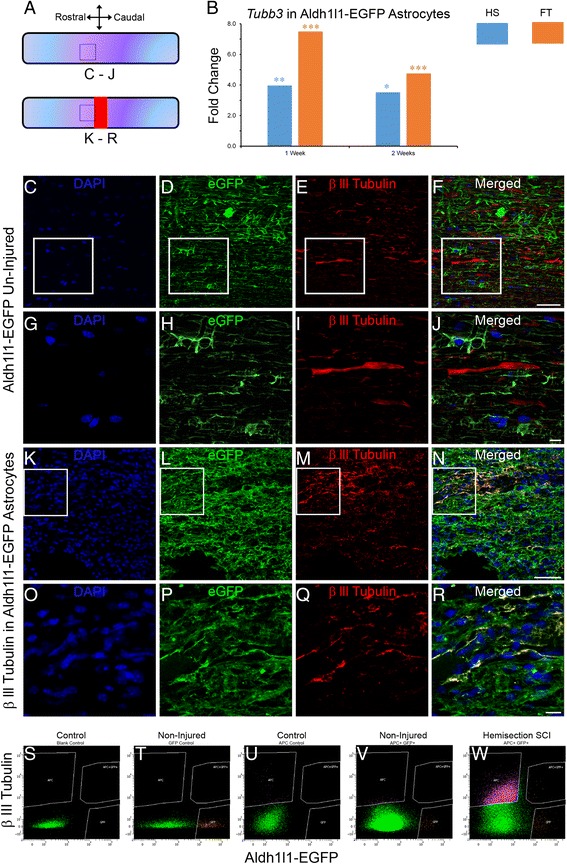
Astroglial conversion into neuronal progenitor cells after SCI. Schematic drawing of longitudinal spinal cord sections from non-injured control and after FT illustrating the lesion site (red rectangle) and reference frames for displayed fields of view (a). Bar graph displaying up-regulation of βIII-tubulin (Tubb3) transcript in astrocytes at different stages after SCI (b). Confocal micrographs of astrocytes in un-injured control showing no eGFP/βIII-tubulin co-expression (c–j). Confocal micrographs confirming βIII-tubulin protein expression in a sub-population of astrocytes in Aldh1l1-EGFP mice at 2 weeks after FT (k–r). Representative flow cytometry analysis dot plots displaying eGFP/βIII-tubulin co-expression only in injured Aldh1l1-EGFP spinal cord 2 weeks after HS (s–w). Surrounded areas, designed as “APC + GFP+”, correspond to the eGFP/βIII-tubulin co-expressing cells. The X and Y-axis represent fluorescent intensity for GFP and βIII-tubulin, respectively. s–u represent multiple controls necessary for the FACS (see material and methods for details). Scale bars (c–f, k–n): 50 μm and (g–j, o–r): 10 μm. a Values are actual fold change ± SEM (*p < 0.05; **p < 0.01; ***p < 0.001 by un-paired t test). c–j non-injured and (k–r) FT 2 weeks