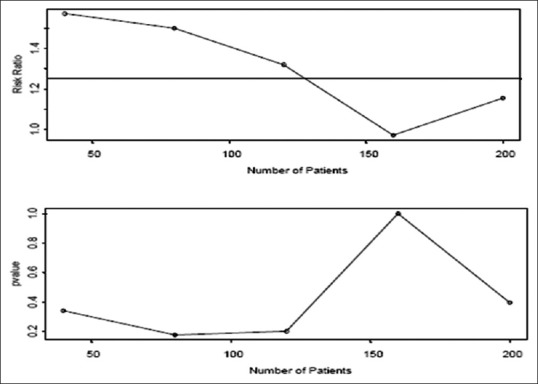
Figure 3.

If we look after every forty patients, we get the scenario where we would not stop either. If we wait until the end of the trial (n = 200), we estimate p1 to be 0.45 and p2 to be 0.52. The P value used for testing shows a significant difference of 0.40
