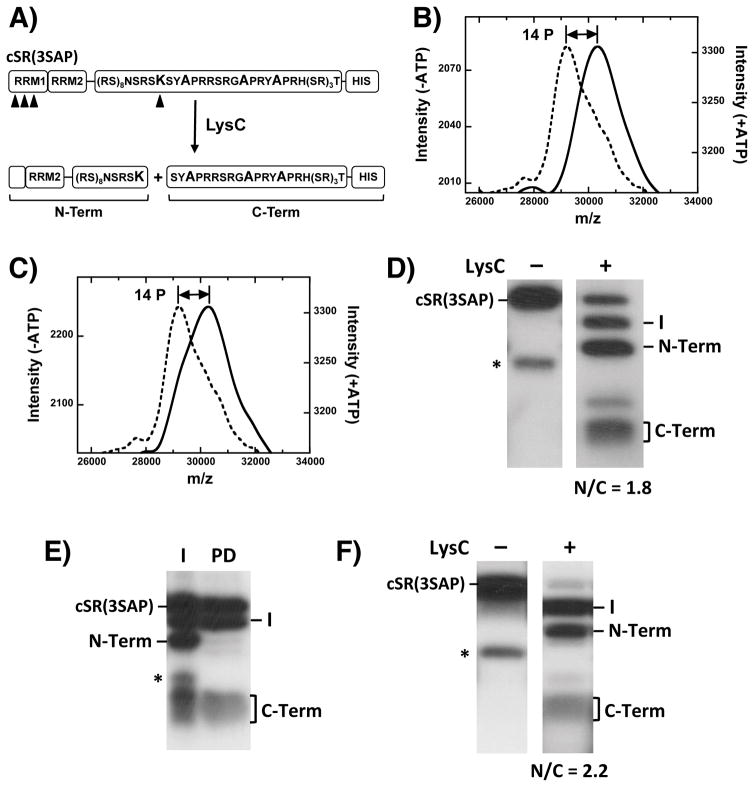
Figure 2. Phospho-Mapping of SRPK1- & CLK1-phosphorylated SR(3SAP).
A) Engineered footprinting protocol. Arrowheads designate LysC cleavage sites. B,C) MALDI-TOF spectra of cSR(3SAP) with SRPK1 (B) and CLK1 (C) in the absence (dotted line) and presence (solid line) of ATP. D) LysC treatment of SRPK1-phosphorylated cSR(3SAP). E) Identification of N- and C-terminal fragments using Ni-resin pull-down experiments. I = Input; PD = pull down. F) LysC treatment of CLK1-phosphorylated cSR(3SAP).

