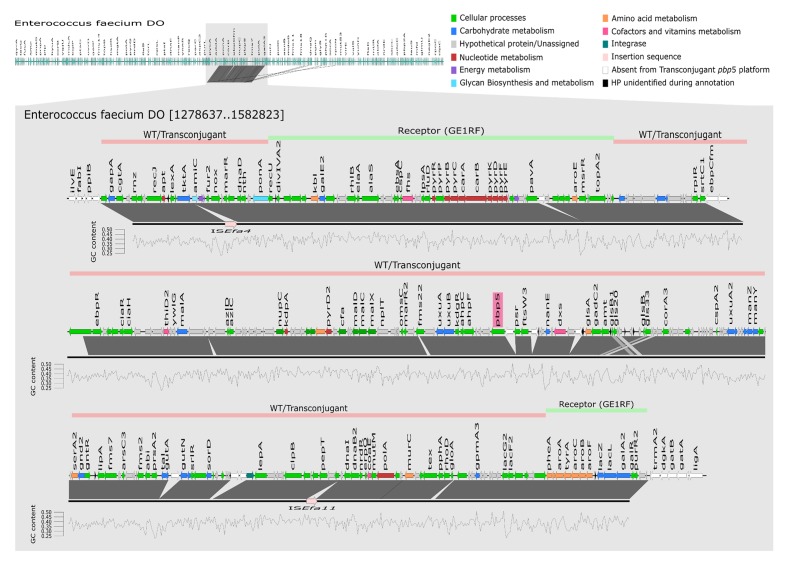
FIGURE 2.
Representation of the transferable chromosomal genetic platform containing pbp5. Mapping and annotation (using KEGG database) of transferable pbp5 genetic platform of transconjugant TCGEHPH2.1 (represented by black line) using E. faecium DO as reference genome. Lines above E. faecium DO genetic structure represent the transferable pbp5 genetic platform observed in wild type and transconjugant isolates (pink) and genomic regions of E. faecium GE1 recipient and transconjugant (green). GC content was calculated using seqinr in Rstudio. The window used to calculate the GC content was 200 bp, represented in the figure by each vertices of the graph. WT, wild type.

