
Fig. 1.
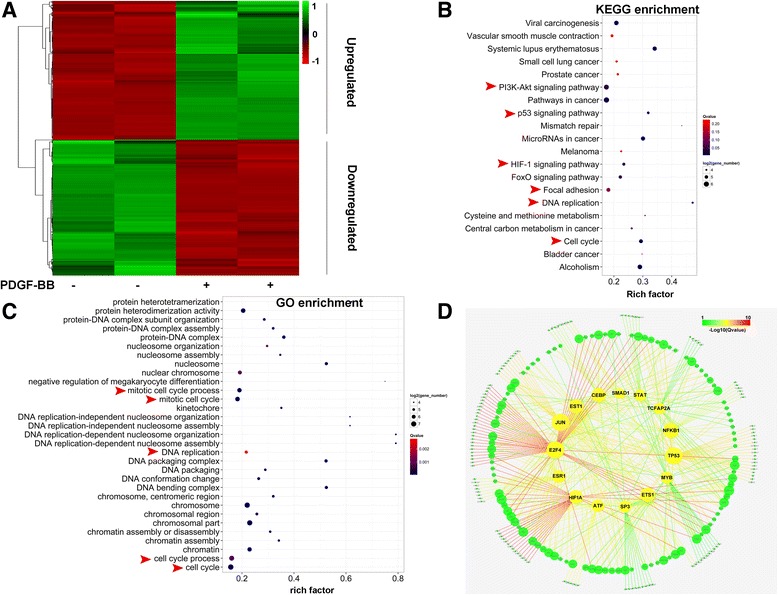
Transcriptome analysis of RPASMCs treated with PDGF-BB. a, RNA sequencing heatmap showing a subset of genes differentially expressed upon RPASMCs treated with PDGF-BB for 12 h (FC > 2, FKPM > 0.5 and Qvalue < 0.05 was shown); b, Gene ontology (GO) analysis was carried out on genes differentially expressed, heatmap showing total expression of genes in the most enriched GO terms; c, the most enriched pathways of differentially expressed genes, analyzing via KEGG pathway; d, The network was constructed with genes differentially expressed and their potential corresponded transcription factors (TFs), showing the 15 most enriched TFs (yellow), Color of line represented the enrichment level. As to a GO or KEGG term, Rich factor = (number of differentially expressed gene) / (total gene number), Qvalue is p-value adjusted by method “Benjamini and Hochberg”