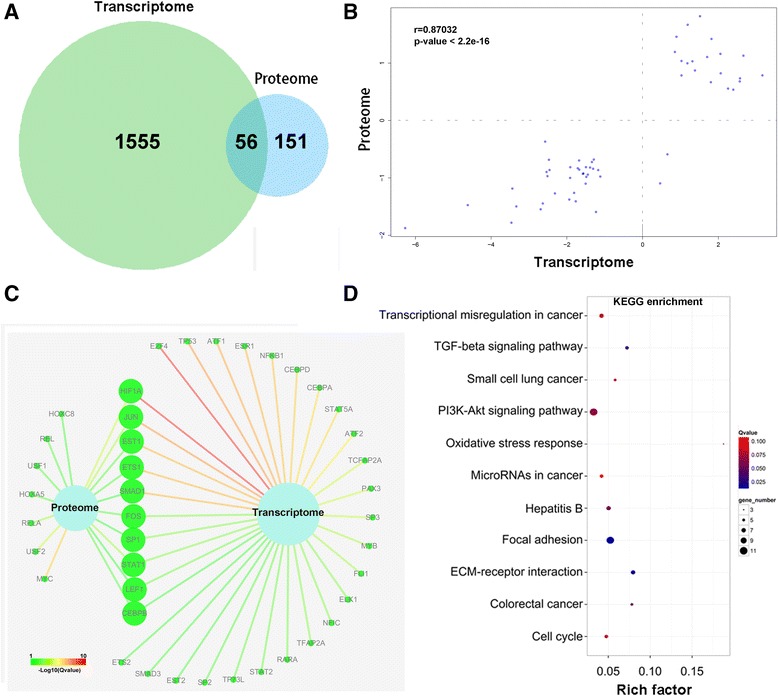
Fig. 3.

Comparison and integration of differential transcriptome and proteome. a, Venn diagram revealing 56 genes expressed differentially in both mRNA and protein levels; b, Differential expression of these 56 genes was significantly correlated (r = 0.87032, p < 0.001, with Pearson test); c, Integration of TF-target network at proteome and transcriptome levels, Color of line represented the enrichment level; d, the most enriched pathway of differentially expressed genes corresponding to SMAD family, analyzing via KEGG pathway. As to a KEGG term, Rich factor = (number of differentially expressed gene) / (total gene number), Q value is p-value adjusted by method “Benjamini and Hochberg”
