Figure 2.
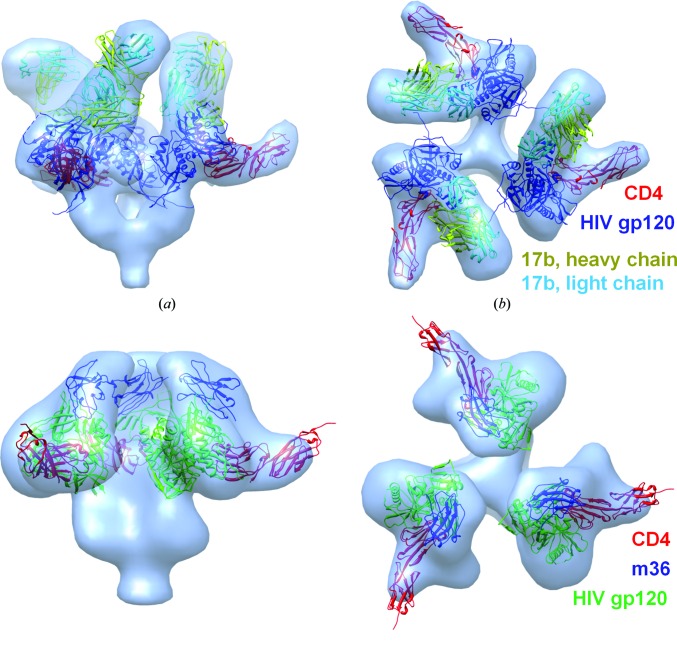
HIV interactions. The best models of HIV gp120–CD4–17b [side (a) and top (b) views] and HIV gp120–CD4–m36 [side (c) and top (d) views] are shown as fitted into their 3DEM density maps (EMDB IDs 5020 and 5554, respectively). In (a) and (b), HIV gp120 is shown in blue, CD4 in red, the heavy chain of 17b in yellow and the light chain of 17b in cyan. In (c) and (d), HIV gp120 is shown in green, CD4 in red and m36 in blue. Three symmetric complexes are created using Chimera based on the symmetry of the density maps.

