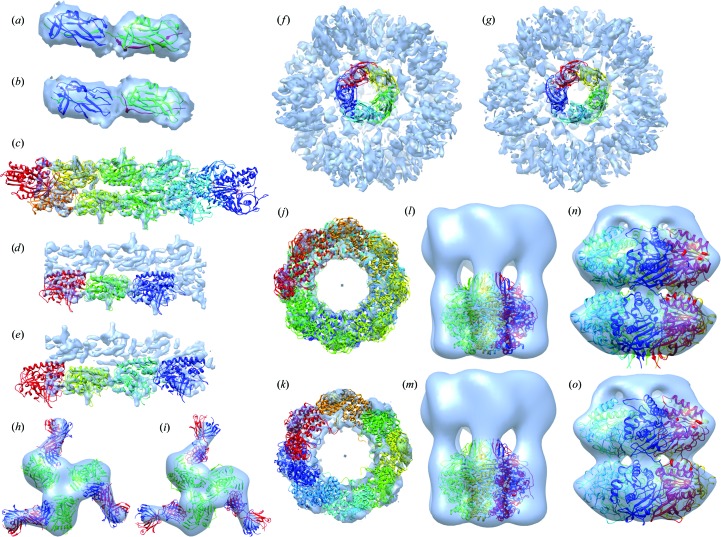
Figure 3.
Benchmark assemblies. The PDB structures and the best models fitted into EM density maps are shown. Each chain is shown in different colours. (a, b) Case 1: Saf pilus type A. PDB entry 3cre (a) and the model (b) are fitted into EMDB ID 1494. (c–e) Case 2: ParM filament. PDB entry 4a6j (c), trimer model (d) and tetramer model (e) are fitted into EMDB ID 1980. (f, g) Case 3: acetylcholine-binding protein type 1. PDB entry 4aod (f) and the model (g) are fitted into EMDB ID 2055; the EM density map level was decreased to 1.80 to obtain an image with the Chimera fit. (h, i) Case 4: VRC-PG04 in complex with HIV-1 gp120. PDB entry 3se9 (h) and the model (i) are fitted into EMDB ID 2427; three complexes are created using Chimera based on the symmetry of the density map. (j, k) Case 5: lidless Mm-cpn. PDB entry 3iyf (j) and the model (k) are fitted into EMDB ID 5140. (l, m) Case 6: conjugal transfer protein TrwB. PDB entry 1e9r (l) and the model (m) are fitted into EMDB ID 5505; the EM density map level was decreased to 0.6 to obtain a distinctive image of the density map. (n, o) Case 7: circadian clock protein KaiC. PDB entry 3dvl (n) and the model (o) are fitted into EMDB ID 5672; the 3DEM density map level was decreased to 0.1 to obtain a distinctive image of the density map.

