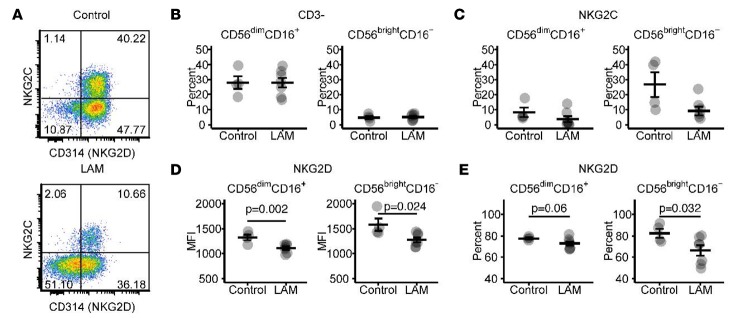
Figure 5. NKG2D expression on NK cells in peripheral blood.
(A) Scatterplot representative of control and lymphangioleiomyomatosis (LAM) patient. (B) Plots indicating percent positive for CD3–CD56brightCD16– and CD3–CD56dimCD16++ NK cells. Sample size for B–D, controls, n = 4; LAM patients, n = 7. (C) Percent expression of NKG2C on CD3–CD56brightCD16– and CD3–CD56dimCD16++ NK cells. (D and E) NKG2D median fluorescent intensity (MFI) and percent positive on CD3–CD56brightCD16– and CD3–CD56dimCD16++ NK cells. Statistical significance indicated by P value of LAM group vs. controls. An unpaired 2-tailed Student’s t test was used to determine statistical significance. Bar represents mean ± SEM.

