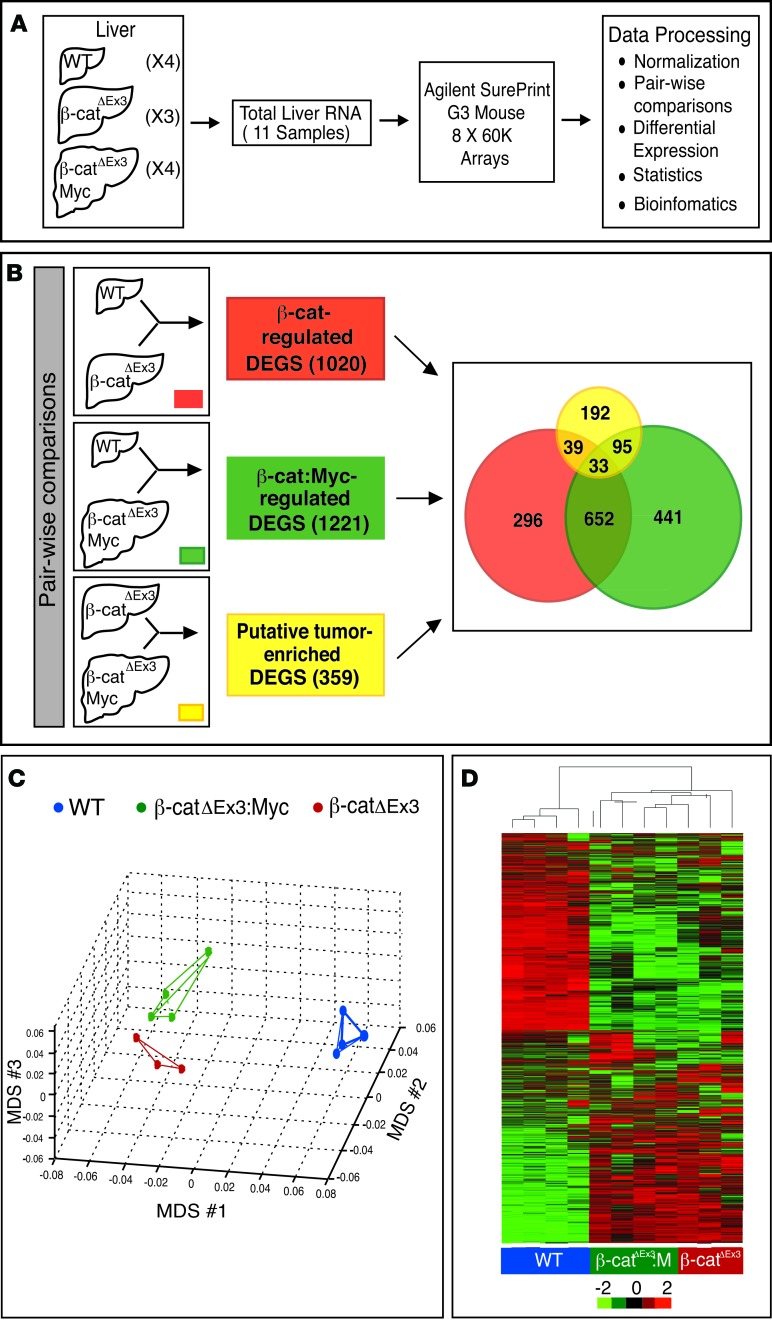
Figure 5. Strategy to identify tumor-enriched and β-catenin–regulated hepatic genes.
(A and B) Schematic showing strategy to identify differentially expressed genes (DEGs). (A) Total RNA isolated from livers of 4 WT, 3 β-catΔEx3, and 4 tumor-bearing β-catΔEx3:Myc mice was profiled using Agilent SurePrint mouse arrays. (B) Pairwise comparisons used to generate lists of β-catenin– (red) and β-catenin– and c-Myc–coregulated genes (green). Tumor-enriched DEGs (yellow) were identified by comparing profiles obtained from β-catΔEx3 livers, which never developed tumors, with those from tumor-bearing β-catΔEx3:Myc livers. The Venn diagram shows the number of unique and overlapping mRNAs identified within and between groups. (C) Multidimensional scaling (MDS) plot depicting the relationship among the transcriptional profiles of WT, β-catΔEx3, and β-catΔEx3:Myc livers. Note that β-catΔEx3 and β-catΔEx3:Myc profiles are similar to one another due to common expression of the mutant β-catenin allele. (D) Heatmap depicting hierarchical clustering of DEGs in livers of WT (blue), β-catΔEx3 (red), and β-catΔEx3:Myc (green) mice.

