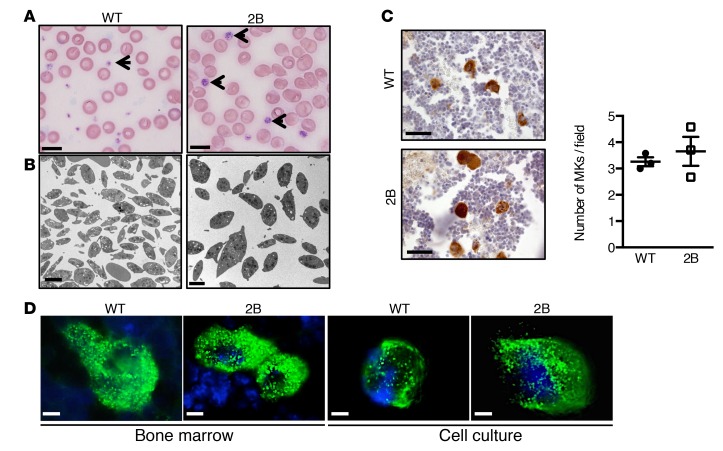
Figure 1. Platelet volume and vWF expression in megakaryocytes (MKs) of the murine model type 2B mutant vWF/p.V1316M (2B).
(A) Representative blood smears of WT and 2B mice. Platelets are shown with arrows. Scale bars: 10 μm. (B) Transmission electron microscopy of WT and 2B platelets. Scale bars: 2 μm. (C) Representative images of MKs (vWF staining [brown] plus H&E) within the bone marrow and quantification of the number of MKs/field in 3 different mice in each genotype. Scale bars: 30 μm. Statistical significance was determined by Student’s t test (P < 0.05). (D) Representative images of vWF expression in MKs within the bone marrow or from cell culture. Scale bars: 10 μm.

