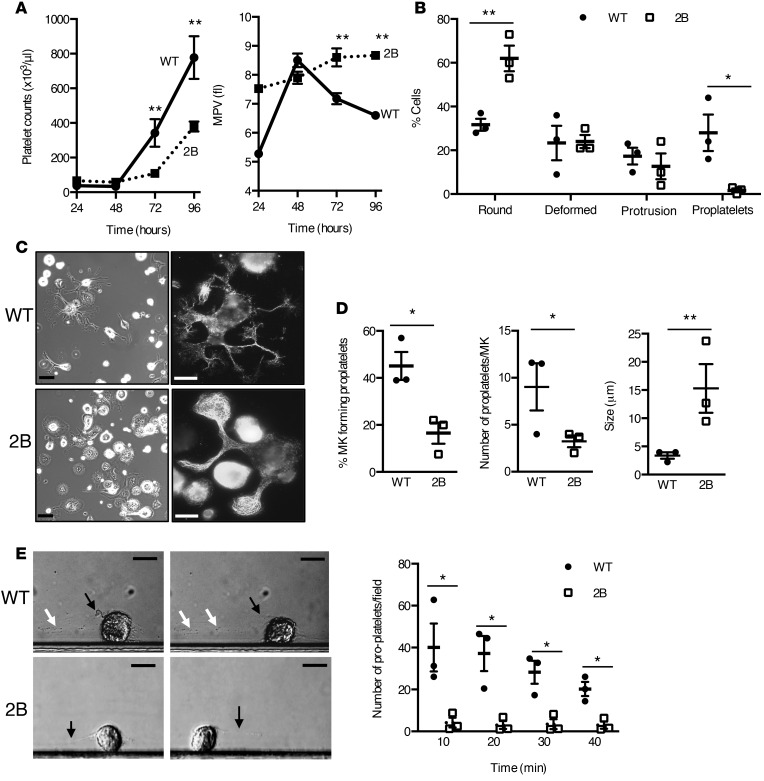
Figure 2. Platelet/proplatelet formation in vivo and in vitro is affected by the p.V1316M mutation.
(A) Whole-blood platelet counts of WT (solid line) or type 2B mutant vWF/p.V1316M (2B, dashed line) mice were obtained after immune-induced thrombocytopenia following intravenous injection of anti–mouse GPIbα antibodies. Platelet counts (left) and mean platelet volume (MPV) (right) were measured at indicated times (n = 9 for WT and 6 for 2B). Statistical significance was determined by 1-way ANOVA followed by Dunnett’s test. **P < 0.01. (B) Quantification of shape change of megakaryocytes (MKs) in bone marrow explant experiments measured in 3 separate experiments (75–125 MKs were analyzed/experiment). (C) Mature MKs were incubated over a fibrinogen matrix for 5 hours. Representative images of MKs (left, scale bars: 50 μm) and representative images of α-tubulin staining in MKs (right, scale bars: 25 μm). (D) Quantification of the percentage of MKs forming proplatelets (left), the number of proplatelets/MK (middle), and the size of platelet-like structures (right) measured in 3 separate experiments. Statistical significance was determined by Student’s t test. *P < 0.05, **P < 0.01 (20–45 MKs were analyzed/experiment). (E) Representative images of WT and 2B MKs forming proplatelets during perfusion over a vWF matrix at a shear stress of 18 dyn/cm2. Black arrows indicate proplatelets attached to the cell, and white arrows indicate platelets and proplatelets released from the MKs. Scale bars: 20 μm. Graph of the quantification of the number of platelets and proplatelets released in the flow chamber during perfusion of mature MKs at 10, 20, 30, and 40 minutes over a vWF matrix. The number of platelets and proplatelets released from MKs and attached in the flow chamber was measured in 3 separate experiments (right). Statistical significance was determined by 1-way ANOVA followed by Dunnett’s test. **P < 0.01.

