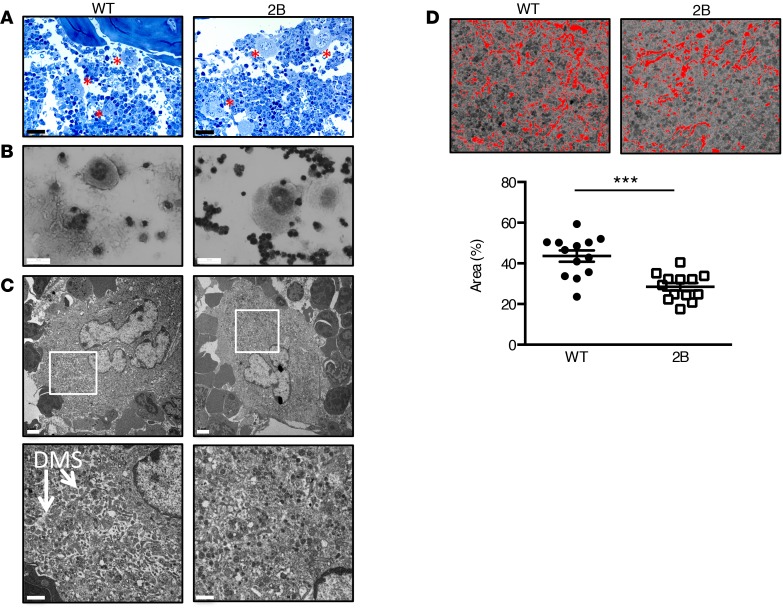
Figure 3. Type 2B mutant vWF/p.V1316M (2B) mice display abnormal megakaryocyte morphology with a decreased demarcation membrane system (DMS).
(A) Representative image of the bone marrow after toluidine blue staining. Megakaryocytes (MKs) are identified with red asterisks. Scale bars: 40 μm. (B) Image of myelogram of the bone marrow. Bone marrow was spread on a coverslip and then stained with H&E. Scale bars: 30 μm. (C) Transmission electron microscopy of stage III MKs in the bone marrow in WT and 2B mice at 2 magnifications. Scale bars: 2 μm (top) and 1 μm (bottom). White squares indicate the magnification zone. n = 4. (D) Images of the threshold (ImageJ software [NIH], in red) in the central zone of MKs used to quantify the area of the DMS in WT (left) and 2B MKs (right) at stage III. Quantification of the area of the DMS of 13 MKs in each group. Statistical significance was determined by Student’s t test. ***P < 0.001.

