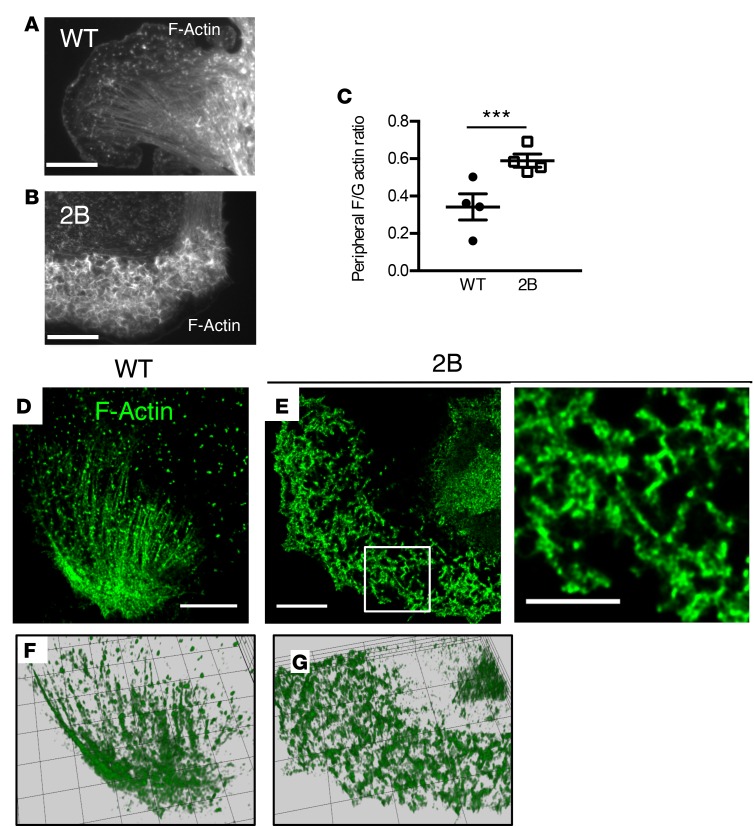
Figure 4. The actin network in type 2B mutant vWF/p.V1316M (2B) megakaryocytes (MKs).
(A and B) Mature MKs after thrombopoietin-induced differentiation in culture were incubated over a fibrinogen matrix for 3 hours. Representative images of the actin structure of WT (A) and 2B MKs (B). Scale bars: 20 μm. (C) Quantification of the F/G-actin integrated intensity in the peripheral zone of 4 separate experiments. Statistical significance was determined by Student’s t test (20–45 MKs were analyzed/experiment). ***P < 0.001. (D and E) Confocal microscopy images of F-actin structure in WT (D) and 2B MKs (E). One image of the z-stack is presented. Scale bars: 10 μm. White squares indicate the magnification zone in 2B MKs (right). (F and G) The complete z-stacks are represented as a 3D-volumetric reconstruction using Icy software. F, WT; G, 2B.

